. 1999 Sep 15;19(18):8083-93.
doi: 10.1523/JNEUROSCI.19-18-08083.1999.

Neuronal interactions improve cortical population coding of movement direction

Affiliations

Neuronal interactions improve cortical population coding of movement direction

E M Maynard et al. J Neurosci. .

Abstract

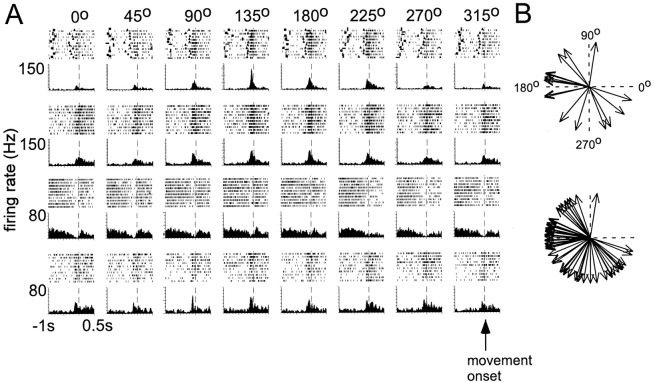
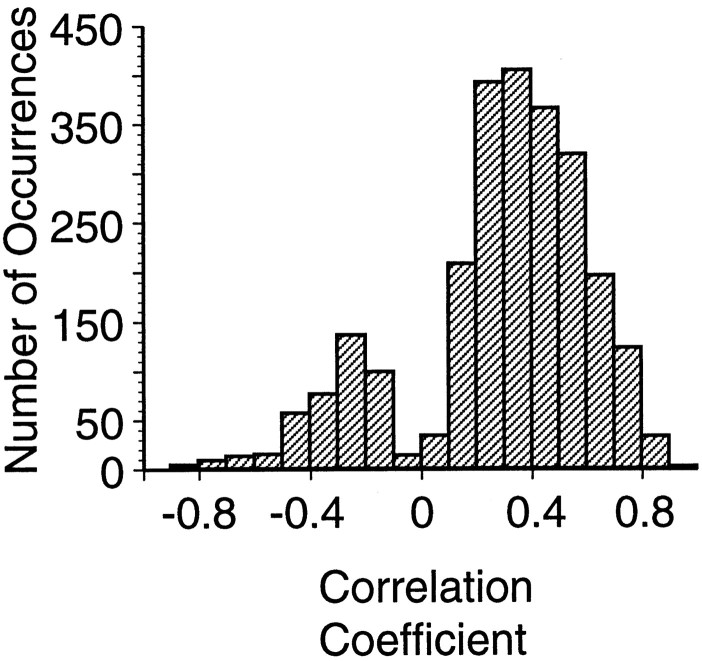
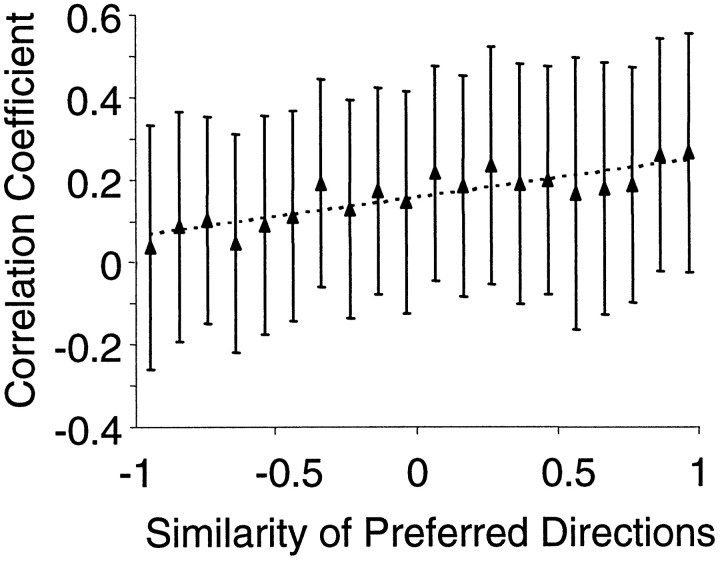
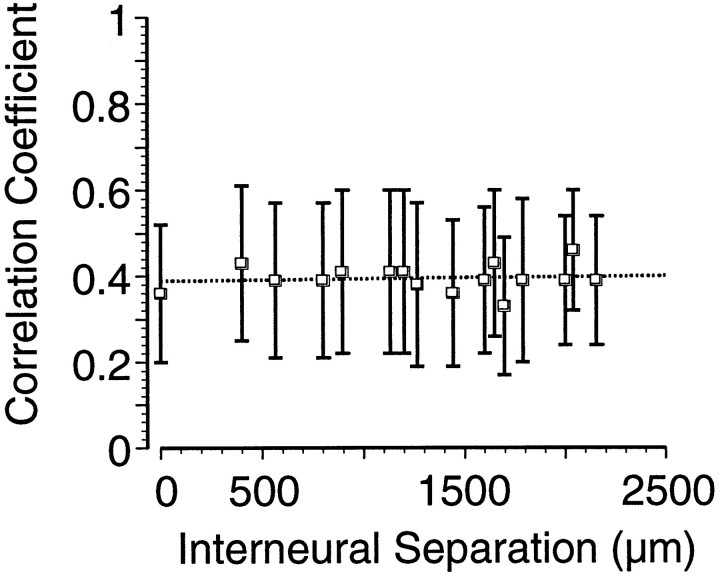
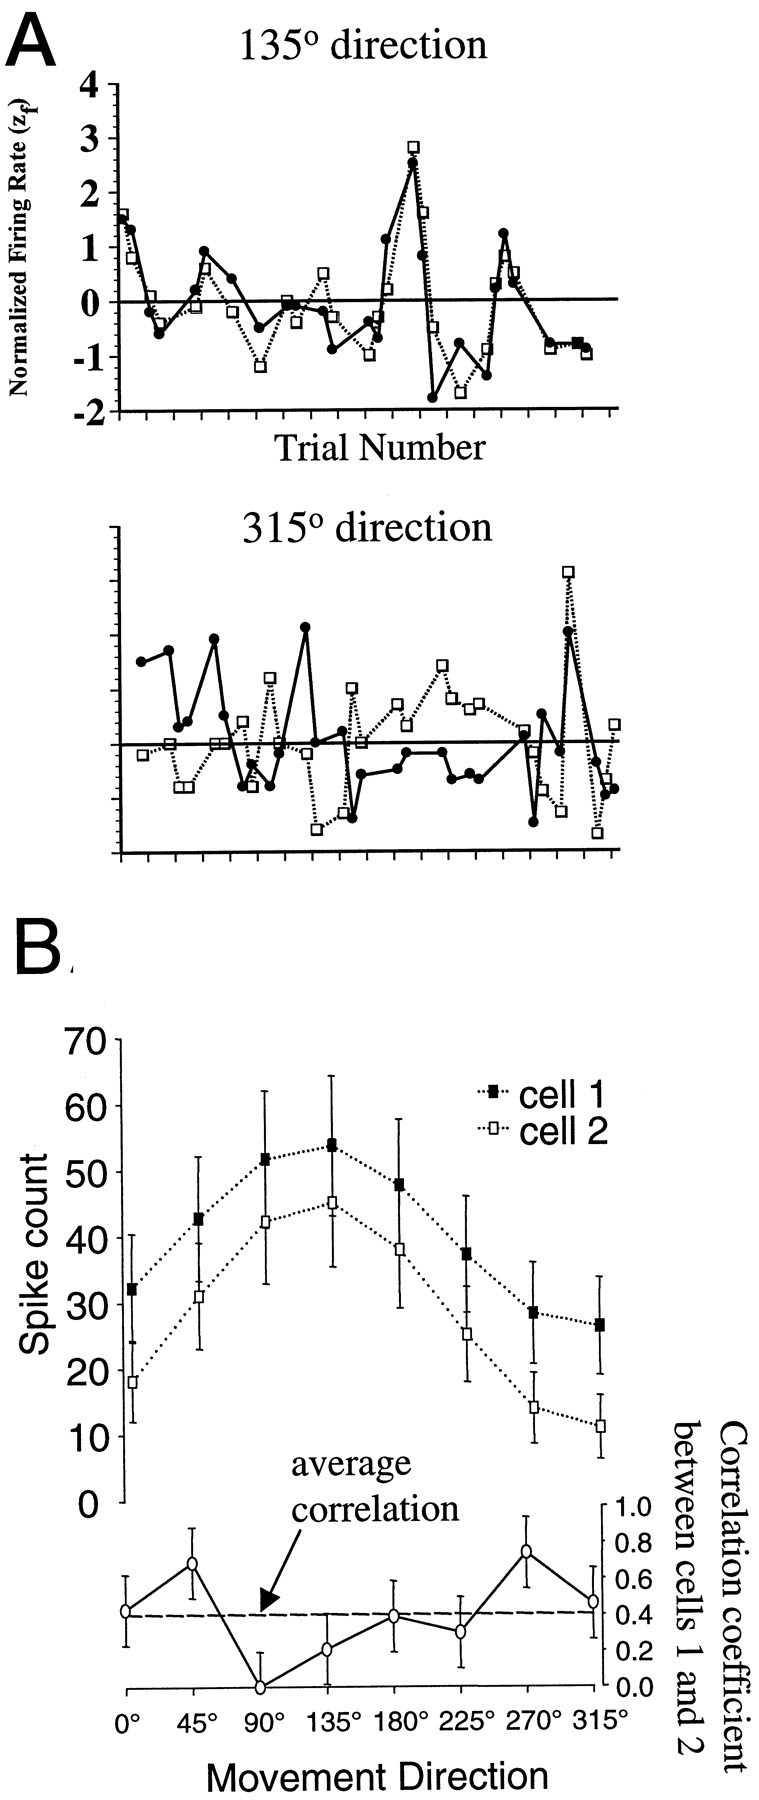
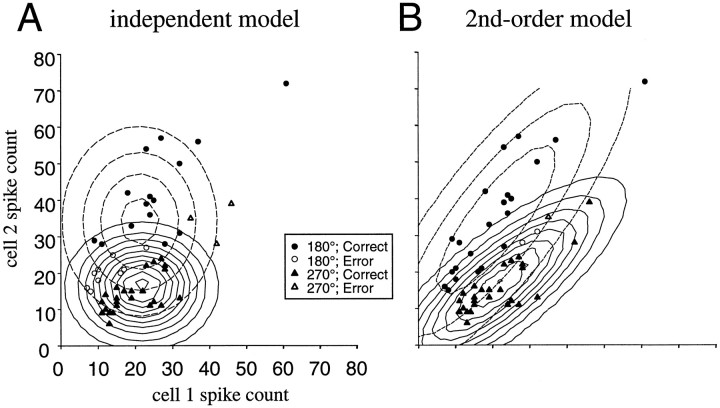
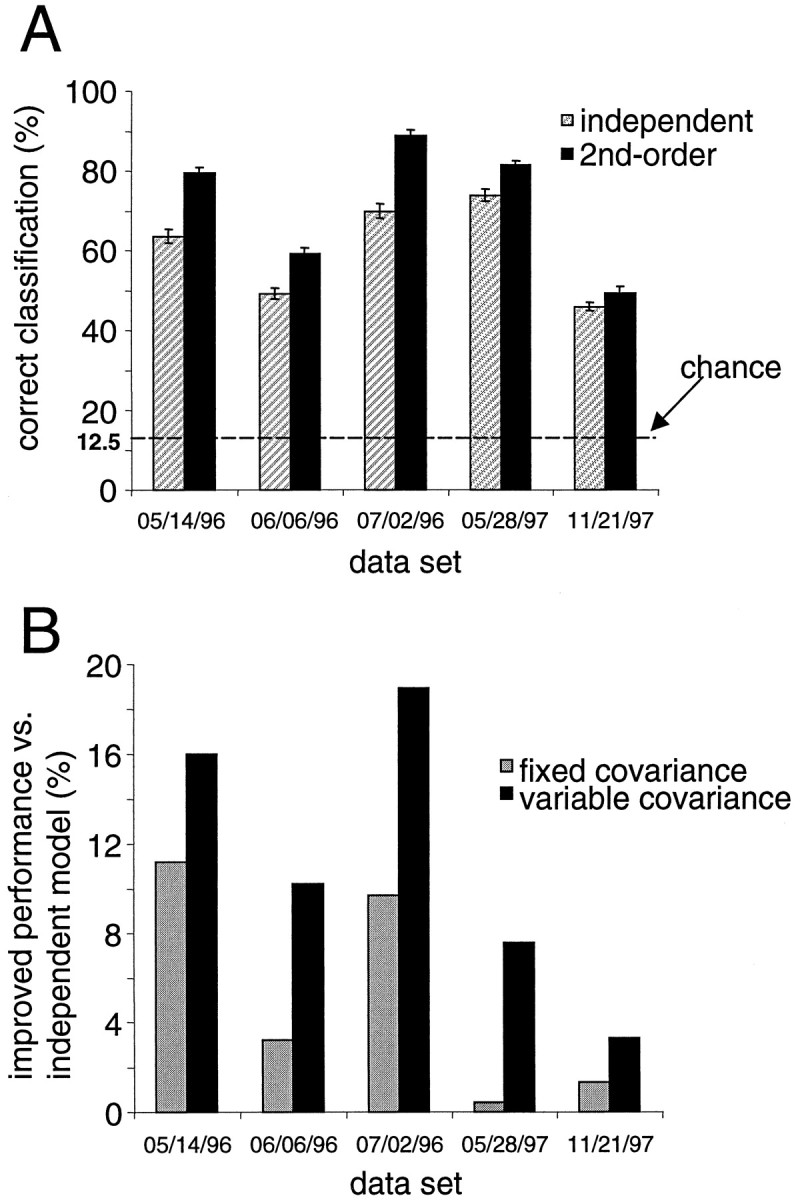
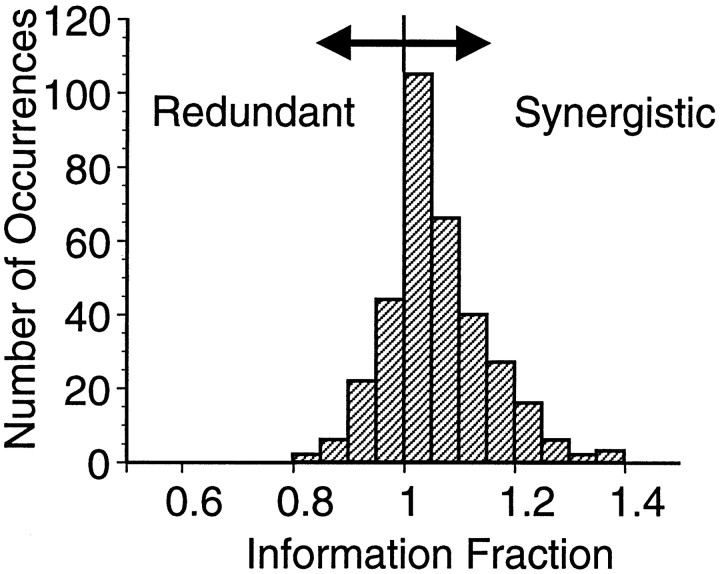
Interactions among groups of neurons in primary motor cortex (MI) may convey information about motor behavior. We investigated the information carried by interactions in MI of macaque monkeys using a novel multielectrode array to record simultaneously from 12-16 neurons during an arm-reaching task. Pairs of simultaneously recorded cells revealed significant correlations in their trial-to-trial firing rate variation when estimated over broad (600 msec) time intervals. This covariation was only weakly related to the preferred directions of the individual MI neurons estimated from the firing rate and did not vary significantly with interelectrode distance. Most significantly, in a portion of cell pairs, correlation strength varied with the direction of the arm movement. We evaluated to what extent correlated activity provided additional information about movement direction beyond that available in single neuron firing rate. A multivariate statistical model successfully classified direction from single trials of neural data. However, classification was consistently better when correlations were incorporated into the model as compared to one in which neurons were treated as independent encoders. Information-theoretic analysis demonstrated that interactions caused by correlated activity carry additional information about movement direction beyond that based on the firing rates of independently acting neurons. These results also show that cortical representations incorporating higher order features of population activity would be richer than codes based solely on firing rate, if such information can exploited by the nervous system.


Figures

Fig. 1.
Fig. 1.
A, Raster plots and perievent histograms of four simultaneously recorded neurons in monkey MI for movements in all eight directions. Each vertical mark in the raster trace is a single action potential attributed to a single neuron. Each row of the raster is a single trial in which the monkey moved from a central hold position to a radially displaced target position. Rasters and histograms are aligned to the onset of movement (dotted line) and show the interval from 1 sec before to 500 msec after the onset of movement. The instruction signal (solid square), go cue (solid triangle), and reward (solid circle) are also shown in the rasters. Each perievent histogram was constructed with a bin width of 20 msec and then smoothed. B, Distributions of the preferred directions for neurons recorded from one data set (top) and from all data sets combined (bottom). The preferred direction of each unit was determined by fitting a cosine curve to the directional tuning function of the unit.
Fig. 2.
Fig. 2.
Trial-to-trial variability in the firing rates of individual neurons for each of the eight movement directions. The SD in the firing rate of each cell for each of the eight movement directions (open circles) is plotted as a function of the average firing rate of the cell in each direction. The dashed line is the result of fitting a power function to this distribution. The solid line is the relationship between the SD and mean predicted from a Poisson process.
Fig. 3.
Fig. 3.
Distribution of response correlations between pairs of MI neurons that were significantly different (p < 0.01) from the shuffled responses. The distribution is constructed from 2502 correlation coefficients calculated for each cell pair in each of the eight movement directions. The bimodal distribution is a result of the removal of the nonsignificant correlation coefficients.
Fig. 4.
Fig. 4.
Mean response correlation coefficients plotted as a function of the similarity between the directional tuning curves. Each mean correlation value is the average of all correlation coefficients within a 0.1 bin (over the x-axis). A weak relationship exists between the strength of correlation and the similarity of the directional tuning of the cells. Error bars indicate SDs.
Fig. 5.
Fig. 5.
Mean significant correlation coefficient values (averaged over each discrete distance) between the responses of two MI neurons as a function of the distance between the electrodes on which the neurons were recorded. No significant relationship between the strength of the correlation and the interelectrode spacing was observed. Error bars indicate SDs. Note that, unlike Figure 4, mean correlation coefficient values are based on only those that were significantly different from zero. When all correlation coefficient values are considered, the relationship between the mean correlation and electrode distance remains flat and nonsignificant.
Fig. 6.
Fig. 6.
Variations in correlated activity with movement direction. A, A cell pair showing strong trial-by-trial covariation in firing for movements in the 135° direction (left) but much weaker covariation for movements in the 315° direction. The normalized firing rates of one cell (open squares and dashed line) are plotted together with those of another cell (solid circles andsolid line) over all trials in the recording session. Whereas the normalized firing rates are significantly correlated for 135° movements (rij = 0.85;p < 0.001), they are not significantly correlated for 315° movements (rij = 0.05;p < 0.79). B, Variations in the firing rates of two cells (top) and in their correlation coefficient (bottom) over eight movement directions. The two cells fire maximally in the 135° direction, whereas their peak correlation occurs in the 45 and 270° directions.
Fig. 7.
Fig. 7.
Classification of trials from one data set into one of two movement direction categories using a pair of simultaneously recorded neurons. Trials are classified correctly (solid) or incorrectly (hollow) as either 180° movements (circles) or 270° movements (triangles). Isoprobability lines represent the joint probability of activity in the two cells conditional on either 180° movements (dashed lines) or 270° movements (solid lines). A, Trials are classified using the independent model in which the two cells are assumed to be uncorrelated. B, Trials are classified using the second-order model in which the covariances between the cells are incorporated into the model.
Fig. 8.
Fig. 8.
A, Results of applying two models to decode the direction of movement from the population of neural responses. Dark bars (second order) are the percentage of trials in which a model incorporating correlations in the trial-to-trial responses of pairs of neurons correctly estimated the movement direction. Hatched bars (independent) are the numbers of trials for which a model that did not incorporate the correlations between cells correctly predicted the direction of movement. These models were applied to five experimental data sets denoted by a seven α-numeric code. B, A comparison in performance of two versions of the second-order model. The improved classification performance of the original second-order model as compared to the independent model is labeled as the “variable covariance” model (black bars). In the other version, the covariance matrix used was fixed and was set to the average over the eight movement directions (gray bars). Notice how the original second-order model does consistently better than the fixed covariance model over all data sets.
Fig. 9.
Fig. 9.
Distribution of the information fraction for pairs of MI neurons. The information fraction measures whether the simultaneously recorded responses of a pair of neurons contain more information than the sum of the information extracted from the two neurons treated separately. Fractions >1.0 indicate that the joint response of the neurons contains more information than the two neurons taken independently. Fractions <1.0 indicate redundancy in the representation of information in the pair of neurons.

References

    1. Abbott LF, Dayan P. The effect of correlated variability on the accuracy of a population code. Neural Comput. 1998;11:91–101. - PubMed
    1. Bair W, Koch C. Temporal precision of spike trains in extrastriate cortex of the behaving macaque monkey. Neural Comput. 1996;8:1185–1202. - PubMed
    1. Buracas GT, Zador AM, DeWeese MR, Albright TD. Efficient discrimination of temporal patterns by motion-sensitive neurons in primate visual cortex. Neuron. 1998;20:959–969. - PubMed
    1. Crow EL, Davis FA, Maxfield MW. Statistics Manual. Dover; New York: 1960.
    1. Deadwyler SA, Bunn T, Hampson RE. Hippocampal ensemble activity during spatial delayed-nonmatch-to-sample performance in rats. J Neurosci. 1996;16:354–372. - PMC - PubMed

Publication types

LinkOut - more resources