. 1999 Sep;121(1):37-44.
doi: 10.1104/pp.121.1.37.

Mechanically induced avoidance response of chloroplasts in fern protonemal cells

Affiliations

Mechanically induced avoidance response of chloroplasts in fern protonemal cells

Y Sato et al. Plant Physiol. 1999 Sep.

Abstract

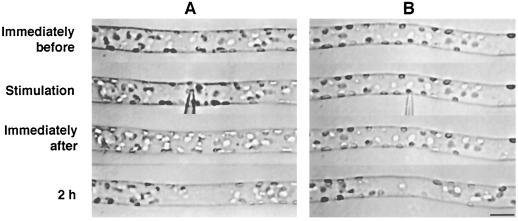
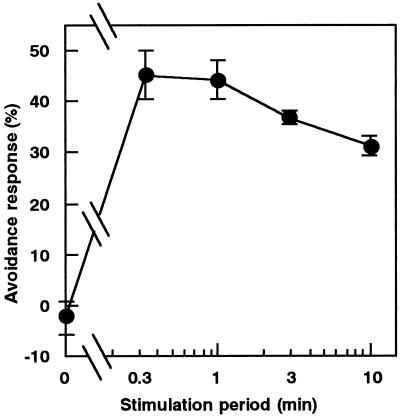
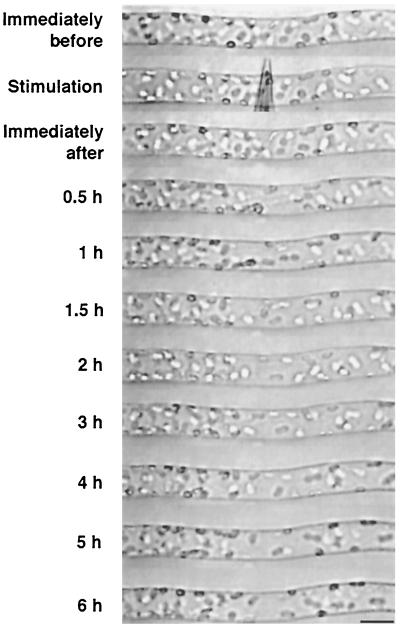
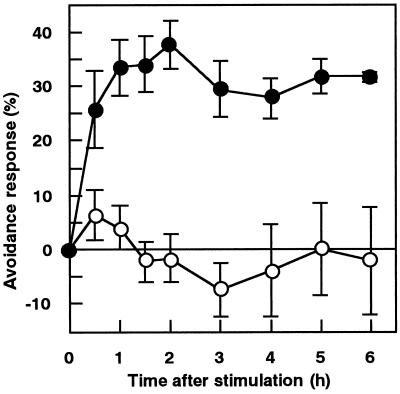
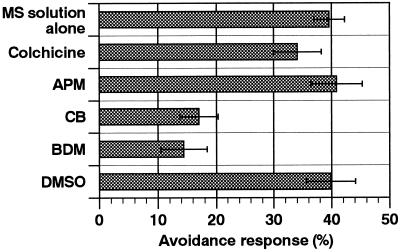
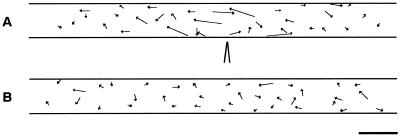
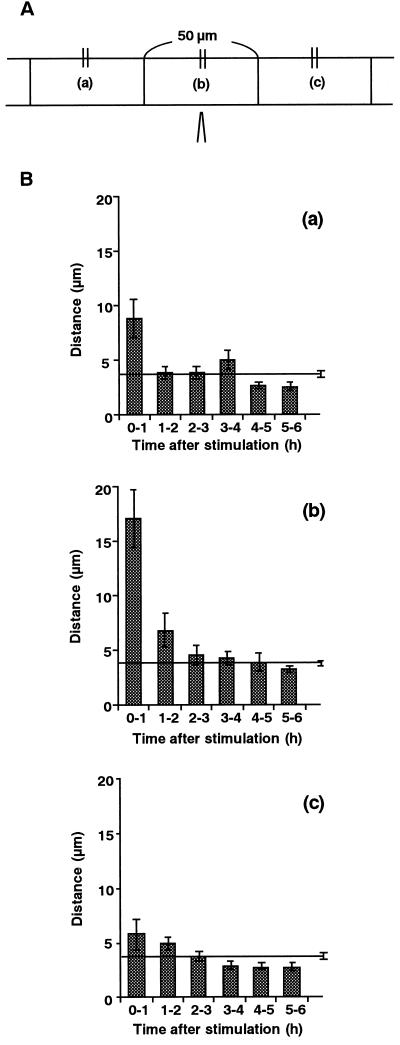
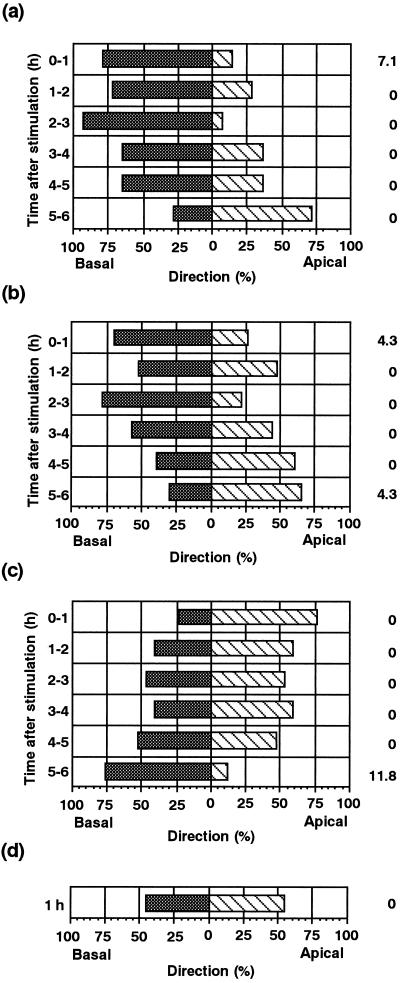
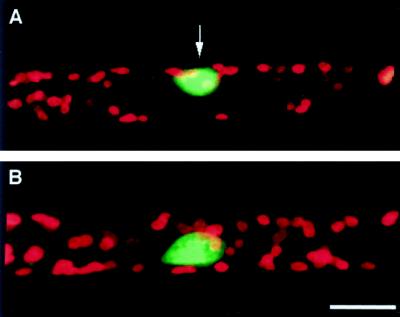
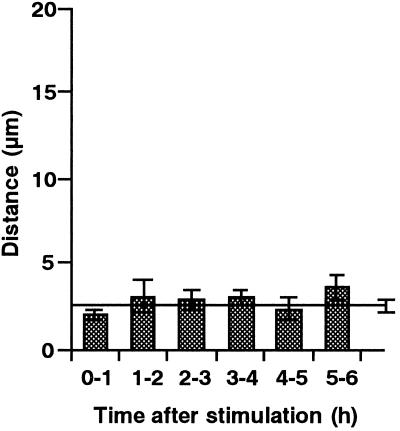
Cell response to mechanical stimulation was investigated at a subcellular level in protonemal cells of the fern Adiantum capillus-veneris L. by pressing a small part of the cell with a microcapillary. In cells receiving local stimulation, the chloroplasts moved away from the site of stimulation, whereas the nuclei failed to show such avoidance movement. Mechanical stimulation for a period as short as 0.3 min was enough to induce the avoidance response to a maximal level. The avoidance movement of chloroplasts started within 30 min and the plateau level of avoidance was attained around 2 h after stimulation. By tracing the movement of chloroplasts during the response, it was shown that the mobility of chloroplasts near the stimulation site increased transiently within 1 h after the stimulation. After 2 to 3 h, it slowed down to the control level without stimulation. The avoidance response was inhibited by 0.1 mM cytochalasin B and 25 mM 2, 3-butanedione monoxime but not by 3.3 microM amiprophosmethyl or 5 mM colchicine. These findings indicate that the protonemal cells were very sensitive to mechanical stimulation and that chloroplasts moved away from the mechanically stimulated site through the actomyosin motile system.


Figures

Figure 1
Figure 1
Avoidance response of chloroplasts induced by mechanical stimulation. A protonemal cell was stimulated either vertically from above with the flank of a microcapillary (A) or horizontally from the side with the tip of the capillary (B). Note the deformation of the protonemal cell at the stimulation site in A. The protonemal tip was on the right. Bar = 20 μm.
Figure 2
Figure 2
Relationship between stimulation periods and the chloroplast avoidance response. Protonemata were pushed for various periods from above with a microcapillary. The avoidance response was assessed 2 h after the stimulation. See Methods for quantification of the response. Each point represents the mean ± se obtained from five to 10 protonemata.
Figure 3
Figure 3
Time-course images of a cell during the chloroplast avoidance response. Part of a cell was stimulated with a microcapillary for 1 min. The cell was continuously observed under IR light through the IR-sensitive video system. The protonemal tip was on the right. Bar = 20 μm.
Figure 4
Figure 4
Time course of the chloroplast avoidance response induced by 1 min of mechanical stimulation. Protonemata were pushed for 1 min with a microcapillary from above (•). Control results without mechanical stimulation are also presented (○). Each point represents the mean ± se obtained from four to five protonemata.
Figure 5
Figure 5
Effects of cytoskeletal inhibitors on the chloroplast avoidance response. Cells were treated with 5 mm colchicine, 3.3 μm APM, 0.1 mm cytochalasin B, or 25 mm BDM in MS solution containing 0.2% detergent. APM, cytochalasin B, and BDM were dissolved with 0.5% DMSO. The control result with 0.5% DMSO alone is also presented. Each bar represents the mean ± se obtained from 11 to 17 protonemata.
Figure 6
Figure 6
Tracking of chloroplast movement during the avoidance response. Start and stop positions of chloroplast tracks made over 1 h after a 1-min mechanical stimulation are linked by arrows (A). Movement of chloroplasts in the control cell without the stimulation are also presented (B). The diagram of needle tip indicates the site of the stimulation. The protonemal tip is on the right. Bar = 20 μm.
Figure 7
Figure 7
Time course of chloroplast mobility after mechanical stimulation. A, Chloroplasts are divided into three groups with respect to their locations before mechanical stimulation: those located in the basal region (a), in the stimulus region (b), and in the apical region (c). Each region is 50 μm in length. B, Distances over which chloroplasts moved were measured in these three regions every hour during for 0 to 6 h after stimulation. The numbers of chloroplasts analyzed were: 14 (a), 23 (b), 17 (c), and 63 (control). Data were obtained from five protonemata. Control data from unstimulated cells are presented as a line with a se bar in each graph.
Figure 8
Figure 8
Direction of chloroplast movement after mechanical stimulation. Direction of chloroplast movement in the basal region (a), in the stimulus region (b), and in the apical region (c) as shown in Figure 7A was analyzed hourly after mechanical stimulation. Chloroplasts that moved toward the apex (hatched bars) and toward the base (shaded bars) are shown as percentages. The percentage of chloroplasts that showed no movement is also shown on the right outside of the column. A control result is shown in d. Data were obtained from the same group of five protonemata as in Figure 7.
Figure 9
Figure 9
Fluorescence micrographs of nuclei and chloroplasts after mechanical stimulation at the nuclear region. Two hours after mechanical stimulation in the nuclear region, a cell was stained with SYTO 11 (A). A cell without the stimulation was also stained and presented as a control (B). Micrographs are shown as combined images of fluorescence of SYTO 11 (green) and of chlorophyll (red). An arrow indicates the site of the stimulation. Bar = 20 μm.
Figure 10
Figure 10
Time course of nuclear movement after mechanical stimulation. After stimulation in the nuclear regions of protonemata, distances over which nuclei moved were measured hourly for 0 to 6 h after stimulation. Each bar represents the mean ± se obtained from seven protonemata. Control data from unstimulated cells are presented as a line with a se bar (n = 7).

References

    1. Cramer LP, Mitchison TJ. Myosin I is involved in postmitotic cell spreading. J Cell Biol. 1995;131:179–189. - PMC - PubMed
    1. Darwin C (1882) The Power of Movement in Plants. John Murray, London
    1. Grabski S, Arnoys E, Busch B, Schindler M. Regulation of actin tension in plant cells by kinases and phosphatases. Plant Physiol. 1998;116:279–290.
    1. Gross P, Julius C, Schmelzer E, Hahlbrock K. Translocation of cytoplasm and nucleus to fungal penetration sites is associated with depolymerization of microtubules and defence gene activation in infected, cultured parsley cells. EMBO J. 1993;12:1735–1744. - PMC - PubMed
    1. Higuchi H, Takemori S. Butanedione monoxime suppresses contraction and ATPase activity of rabbit skeletal muscle. J Biochem. 1989;105:638–643. - PubMed

Publication types

MeSH terms

LinkOut - more resources