. 1999 Sep 14;96(19):10689-94.
doi: 10.1073/pnas.96.19.10689.

Modeling evolutionary landscapes: mutational stability, topology, and superfunnels in sequence space

Affiliations

Modeling evolutionary landscapes: mutational stability, topology, and superfunnels in sequence space

E Bornberg-Bauer et al. Proc Natl Acad Sci U S A. .

Abstract

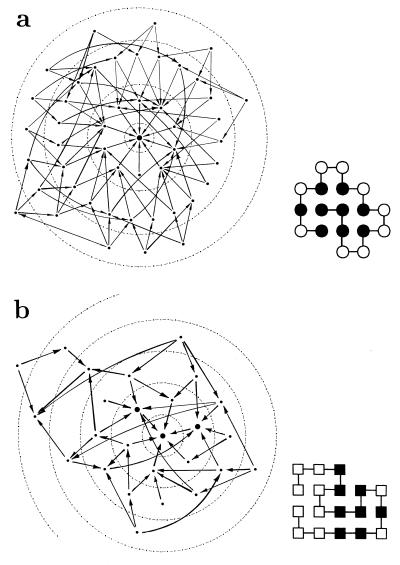
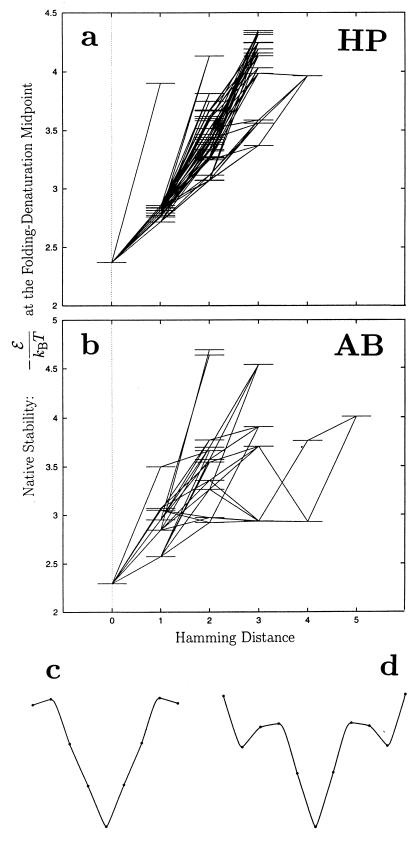
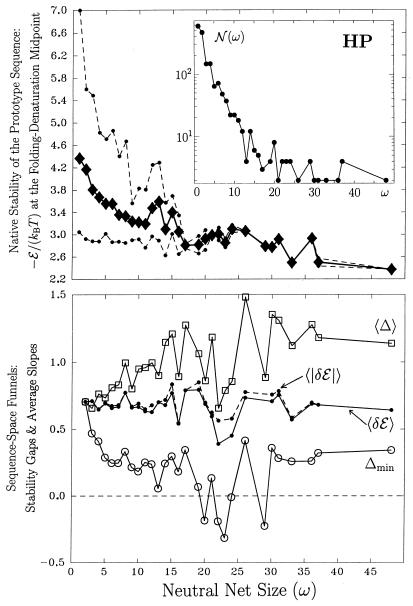
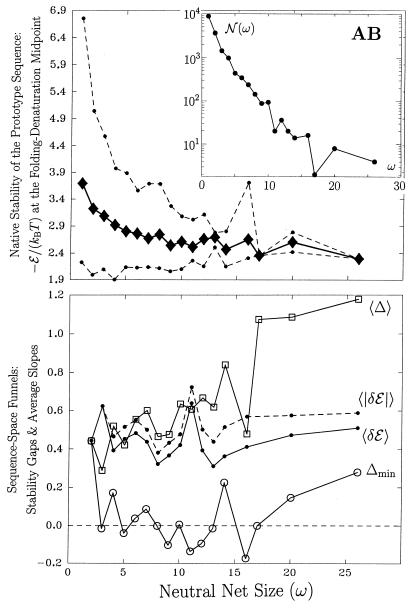
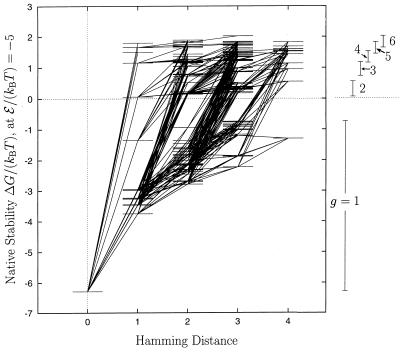
Random mutations under neutral or near-neutral conditions are studied by considering plausible evolutionary trajectories on "neutral nets"-i.e., collections of sequences (genotypes) interconnected via single-point mutations encoding for the same ground-state structure (phenotype). We use simple exact lattice models for the mapping between sequence and conformational spaces. Densities of states based on model intrachain interactions are determined by exhaustive conformational enumeration. We compare results from two very different interaction schemes to ascertain robustness of the conclusions. In both models, sequences in a majority of neutral nets center around a single "prototype sequence" of maximum mutational stability, tolerating the largest number of neutral mutations. General analytical considerations show that these topologies by themselves lead to higher steady-state evolutionary populations at prototype sequences. On average, native thermodynamic stability increases toward a maximum at the prototype sequence, resulting in funnel-like arrangements of native stabilities in sequence space. These observations offer a unified perspective on sequence design, native stability, and mutational stability of proteins. These principles are generalizable from native stability to any measure of fitness provided that its variation with respect to mutations is essentially smooth.


Figures

Figure 1
Figure 1
Largest neutral net in (a) the HP model (48 sequences) and (b) AB model (26 sequences). The native structures are given in their respective prototype sequences. H, P, A, and B monomers are represented by filled and open circles and filled and open squares, respectively (29). The topology of each neutral net is shown by representing each sequence by a dot. A connecting line with arrow indicates that two sequences are neutral neighbors (16). Arrows point toward the sequence with higher native stability (see Fig. 2). Larger dots represent sequences with the maximum number of neutral neighbors within the neutral net. Concentric circles in dotted lines indicate Hamming distance from the prototype sequence.
Figure 2
Figure 2
Native stabilities of the sequences in the (a) HP and (b) AB neutral nets in Fig. 1 are represented as horizontal lines. The horizontal axis indicates Hamming distance from the prototype sequence. Neutral mutations are indicated by lines connecting horizontal levels. Heuristic views of (c) the HP and (d) AB “superfunnels” are traces through average stabilities of the sequences as a function of Hamming distance (dots). In c and d, the bottom at the center of each funnel corresponds to the prototype sequence; horizontal displacement from the center in either direction corresponds to increasing Hamming distance from the prototype sequence.
Figure 3
Figure 3
Superfunnel geometry. (Upper) Thermodynamic stability of prototype sequences. For neutral nets of a given size, diamond shows the average stability, whereas dots show the maximum and minimum stabilities among the prototype sequences from different neutral nets. (Inset) 𝒩 (ω) is the number of neutral nets with size ω. All solid or dashed lines linking data points in Figs. 3 and 4 serve merely as visual guides. (Lower) For a given neutral net, Δ is the difference in thermodynamic stability [measured in transition-midpoint −/(kBT)] between a nonprototype sequence and the prototype sequence. The average stability gap 〈Δ〉 is the average of Δ over all nonprototype sequences in the net; thus it provides a measure of “depth” of a neutral net. The minimum stability gap Δmin is the smallest value of Δ within a neutral net. Hence Δmin < 0 implies the neutral net is not a superfunnel. Averages of 〈Δ〉 (squares) and Δmin (circles) over neutral nets of given sizes are plotted. For neutral nets that satisfy the superfunnel criterion (Δmin ≥ 0), average slopes are also computed. For every neutral mutation, δ is a sequence-space slope. It is equal to the transition-midpoint −/(kBT) of the sequence one Hamming step further from the prototype sequence minus that of its neutral neighbor that is one step closer. 〈δ〉 is the average of δ over all mutations within a neutral net. Because some neutral mutations lead to negative slopes (δ < 0), we also compute the average of their absolute values, 〈|δ|〉. Averages of these two quantities over neutral nets of given sizes are plotted as dots connected by solid (〈δ〉) and dashed (〈|δ|〉) lines.
Figure 4
Figure 4
Same as Fig. 3 except for AB sequences.
Figure 5
Figure 5
Extended neutral net for the HP structure in Fig. 1, with 146 sequences. Same as Fig. 2a, except that native stabilities of the sequences are now measured by free energy of folding (Eq. 3) and that multiply-degenerate sequences (degeneracy g ≤ 6) are included. Numbers of sequences with g = 1, 2, 3, 4, 5, and 6 in this net are 48, 22, 16, 27, 14, and 19, respectively. The vertical bars and numbers on the right indicate the range of stability levels for sequences with different gs.

Similar articles

Cited by

References

    1. Wright S. In: Proceedings of the Sixth International Congress on Genetics, Vol. 1. Jones D F, editor. New York: Brooklyn Botanic Gardens; 1932. pp. 356–366.
    1. Kimura M. The Neutral Theory of Molecular Evolution. Cambridge: Cambridge Univ. Press; 1983.
    1. Kauffman S, Levin S. J Theor Biol. 1987;128:11–45. - PubMed
    1. Fontana W, Schuster P. Biophys Chem. 1987;26:123–147. - PubMed
    1. Huynen M A, Stadler P F, Fontana W. Proc Natl Acad Sci USA. 1996;93:397–401. - PMC - PubMed

Publication types

LinkOut - more resources