

Identification of a zinc finger protein whose subcellular distribution is regulated by serum and nerve growth factor
- PMID: 10485890
- PMCID: PMC17947
- DOI: 10.1073/pnas.96.19.10705
Identification of a zinc finger protein whose subcellular distribution is regulated by serum and nerve growth factor
Abstract
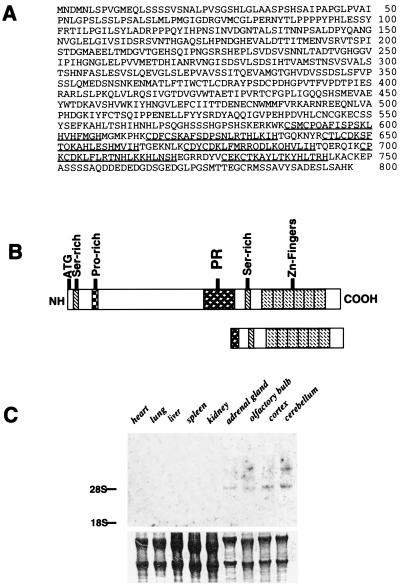
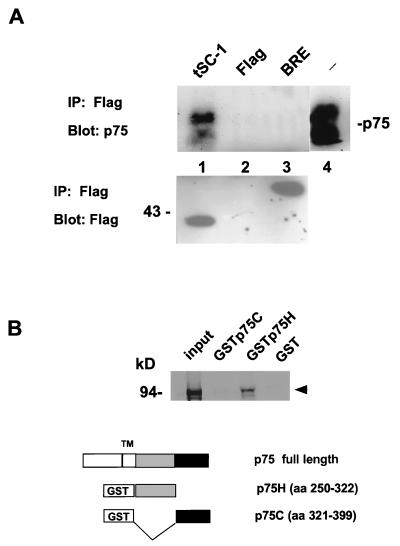
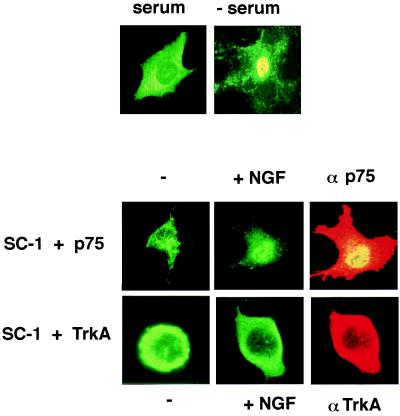
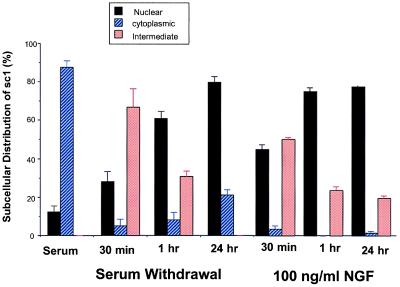
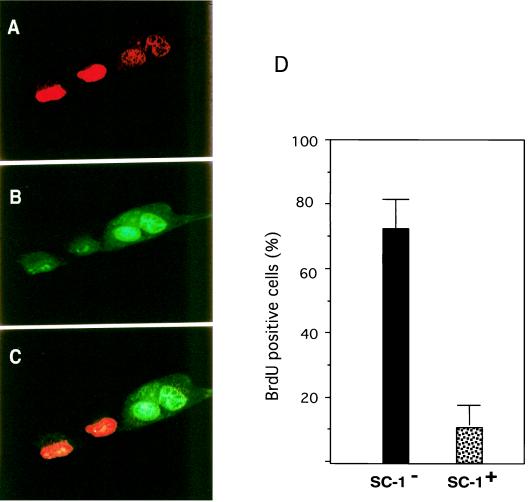
A subclass of zinc finger proteins containing a unique protein motif called the positive regulatory (PR) domain has been described. The members include the PRDI-BF1/Blimp-1 protein, the Caenorhabditis elegans egl-43 and EVI1 gene products, and the retinoblastoma interacting protein RIZ. Here we describe a member of this family, SC-1, that exhibits several distinctive features. First, SC-1 interacts with the p75 neurotrophin receptor and is redistributed from the cytoplasm to the nucleus after nerve growth factor (NGF) treatment of transfected COS cells. The translocation of SC-1 to the nucleus was specific for p75, as NGF binding to the TrkA receptor did not lead to nuclear localization of SC-1. Thus, SC-1 provides a downstream transducer for the effects of NGF through the p75 neurotrophin receptor. Under normal growth conditions, SC-1 was found predominantly in the cytoplasm. On serum-starvation, SC-1 also translocated into the nucleus. A direct correlation between nuclear expression of SC-1 with the loss of BrdUrd incorporation was observed. These results imply that SC-1 may be involved in events associated with growth arrest.
Figures

Similar articles
-
Selective activation of NF-kappa B by nerve growth factor through the neurotrophin receptor p75.Science. 1996 Apr 26;272(5261):542-5. doi: 10.1126/science.272.5261.542. Science. 1996. PMID: 8614802
-
Specific neurotrophin binding to leucine-rich motif peptides of TrkA and TrkB.FEBS Lett. 1995 Oct 23;374(1):125-9. doi: 10.1016/0014-5793(95)01047-i. FEBS Lett. 1995. PMID: 7589499
-
Structural determinants of Trk receptor specificities using BDNF-based neurotrophin chimeras.J Neurosci Res. 1996 Dec 1;46(5):618-29. doi: 10.1002/(SICI)1097-4547(19961201)46:5<618::AID-JNR10>3.0.CO;2-T. J Neurosci Res. 1996. PMID: 8951673
-
p75 and Trk: a two-receptor system.Trends Neurosci. 1995 Jul;18(7):321-6. Trends Neurosci. 1995. PMID: 7571013 Review.
-
The trk family of oncogenes and neurotrophin receptors.Princess Takamatsu Symp. 1991;22:153-70. Princess Takamatsu Symp. 1991. PMID: 1844238 Review.
Cited by
-
Activation of Rac GTPase by p75 is necessary for c-jun N-terminal kinase-mediated apoptosis.J Neurosci. 2002 Jan 1;22(1):156-66. doi: 10.1523/JNEUROSCI.22-01-00156.2002. J Neurosci. 2002. PMID: 11756498 Free PMC article.
-
A prosurvival function for the p75 receptor death domain mediated via the caspase recruitment domain receptor-interacting protein 2.J Neurosci. 2001 Aug 15;21(16):5854-63. doi: 10.1523/JNEUROSCI.21-16-05854.2001. J Neurosci. 2001. PMID: 11487608 Free PMC article.
-
p75 neurotrophin receptor expression defines a population of BDNF-responsive neurogenic precursor cells.J Neurosci. 2007 May 9;27(19):5146-55. doi: 10.1523/JNEUROSCI.0654-07.2007. J Neurosci. 2007. PMID: 17494700 Free PMC article.
-
c-jun is essential for sympathetic neuronal death induced by NGF withdrawal but not by p75 activation.J Cell Biol. 2002 Aug 5;158(3):453-61. doi: 10.1083/jcb.200112129. Epub 2002 Aug 5. J Cell Biol. 2002. PMID: 12163468 Free PMC article.
-
PRDM Proteins: Molecular Mechanisms in Signal Transduction and Transcriptional Regulation.Biology (Basel). 2013 Jan 14;2(1):107-41. doi: 10.3390/biology2010107. Biology (Basel). 2013. PMID: 24832654 Free PMC article.
References
Publication types
MeSH terms
Substances
Associated data
- Actions
LinkOut - more resources
Full Text Sources
Other Literature Sources
Molecular Biology Databases
Research Materials
Miscellaneous
