Competition for antigenic sites during T cell proliferation: a mathematical interpretation of in vitro data
- PMID: 10485903
- PMCID: PMC17960
- DOI: 10.1073/pnas.96.19.10782
Competition for antigenic sites during T cell proliferation: a mathematical interpretation of in vitro data
Abstract
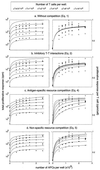
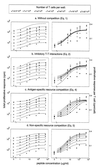
By fitting different mathematical T cell proliferation functions to in vitro T cell proliferation data, we studied T cell competition for stimulatory signals. In our lymphocyte proliferation assays both the antigen (Ag) availability and the concentration of T cells were varied. We show that proliferation functions involving T cell competition describe the data significantly better than classical proliferation functions without competition, thus providing direct evidence for T cell competition in vitro. Our mathematical approach allowed us to study the nature of T cell competition by comparing different proliferation functions involving (i) direct inhibitory T-T interactions, (ii) Ag-specific resource competition, or (iii) resource competition for nonspecific factors such as growth factors, and access to the surface of Ag-presenting cells (APCs). We show that resource competition is an essential ingredient of T cell proliferation. To discriminate between Ag-specific and nonspecific resource competition, the Ag availability was varied in two manners. In a first approach we varied the concentration of APCs, displaying equal ligand densities; in a second approach we varied the Ag density on the surface of the APCs, while keeping the APC concentration constant. We found that both resource competition functions described the data equally well when the Ag availability was increased by adding APCs. When the APC concentration was kept constant, the nonspecific resource competition function yielded the best description of the data. Our interpretation is that T cells were competing for "antigenic sites" on the APCs.
Figures


Similar articles
-
Ocular surface APCs are necessary for autoreactive T cell-mediated experimental autoimmune lacrimal keratoconjunctivitis.J Immunol. 2011 Oct 1;187(7):3653-62. doi: 10.4049/jimmunol.1101442. Epub 2011 Aug 31. J Immunol. 2011. PMID: 21880984
-
B lymphocytes as antigen-presenting cells for CD4+ T cell priming in vivo.J Immunol. 1999 May 15;162(10):5695-703. J Immunol. 1999. PMID: 10229801
-
Antigen presenting cells (APCs) from thermally injured and/or septic rats modulate CD4+ T cell responses of naive rat.Biochim Biophys Acta. 2006 Jan;1762(1):46-53. doi: 10.1016/j.bbadis.2005.07.005. Epub 2005 Oct 11. Biochim Biophys Acta. 2006. PMID: 16257513
-
Two roles for Ia in antigen-specific T cell activation. II. Toward a Velcro model of antigen recognition.J Immunol. 1988 Apr 15;140(8):2500-7. J Immunol. 1988. PMID: 3258611
-
An APC for every occasion: induction and expansion of human Ag-specific CD4 and CD8 T cells using cellular and non-cellular APC.Cytotherapy. 2004;6(5):440-9. doi: 10.1080/14653240410005230. Cytotherapy. 2004. PMID: 15512910 Review.
Cited by
-
Effect of cellular aging on memory T-cell homeostasis.Front Immunol. 2022 Aug 8;13:947242. doi: 10.3389/fimmu.2022.947242. eCollection 2022. Front Immunol. 2022. PMID: 36059495 Free PMC article.
-
A mathematical design of vector vaccine against autoimmune disease.J Theor Biol. 2009 Feb 7;256(3):382-92. doi: 10.1016/j.jtbi.2008.09.038. Epub 2008 Oct 19. J Theor Biol. 2009. PMID: 18996399 Free PMC article.
-
Predictive models of type 1 diabetes progression: understanding T-cell cycles and their implications on autoantibody release.PLoS One. 2014 Apr 4;9(4):e93326. doi: 10.1371/journal.pone.0093326. eCollection 2014. PLoS One. 2014. PMID: 24705439 Free PMC article.
-
No evidence for competition between cytotoxic T-lymphocyte responses in HIV-1 infection.Proc Biol Sci. 2009 Dec 22;276(1677):4389-97. doi: 10.1098/rspb.2009.1232. Epub 2009 Sep 23. Proc Biol Sci. 2009. PMID: 19776069 Free PMC article.
-
Strategic Priming with Multiple Antigens can Yield Memory Cell Phenotypes Optimized for Infection with Mycobacterium tuberculosis: A Computational Study.Front Microbiol. 2016 Jan 6;6:1477. doi: 10.3389/fmicb.2015.01477. eCollection 2015. Front Microbiol. 2016. PMID: 26779136 Free PMC article.
References
Publication types
MeSH terms
LinkOut - more resources
Full Text Sources
Miscellaneous

