. 1999 Oct;19(10):6825-32.
doi: 10.1128/MCB.19.10.6825.

An autoregulatory loop controlling CYP1A1 gene expression: role of H(2)O(2) and NFI

Affiliations

An autoregulatory loop controlling CYP1A1 gene expression: role of H(2)O(2) and NFI

Y Morel et al. Mol Cell Biol. 1999 Oct.

Abstract

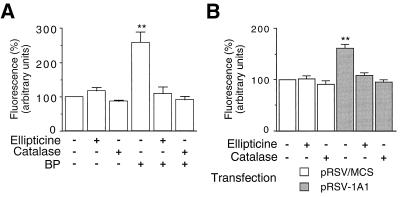
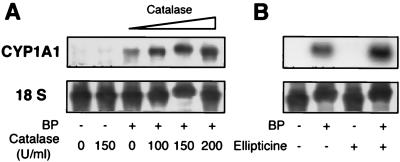
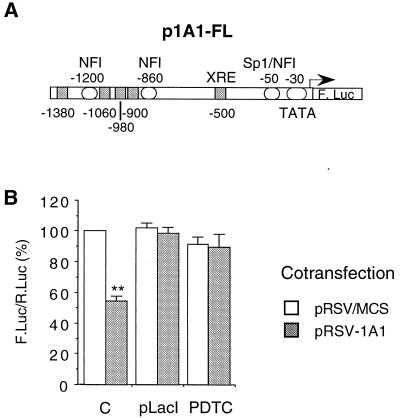
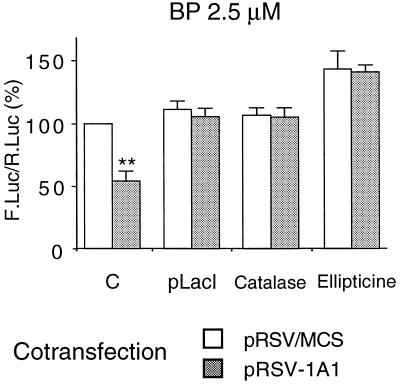
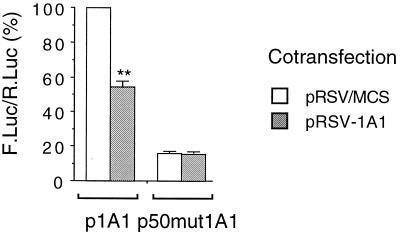
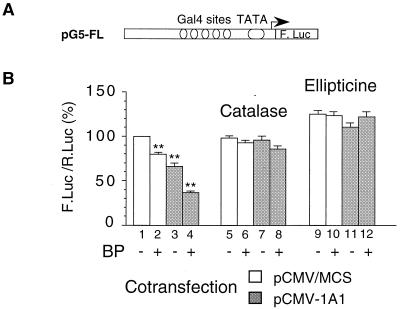
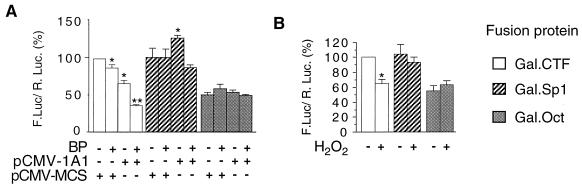
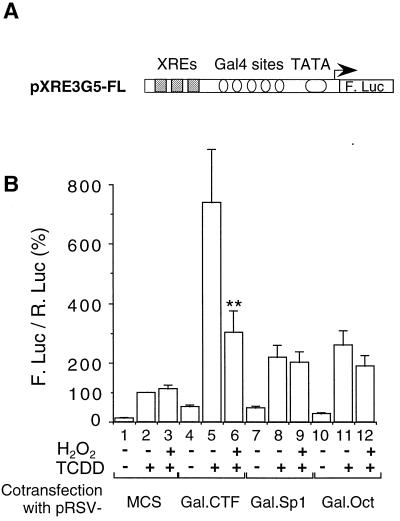
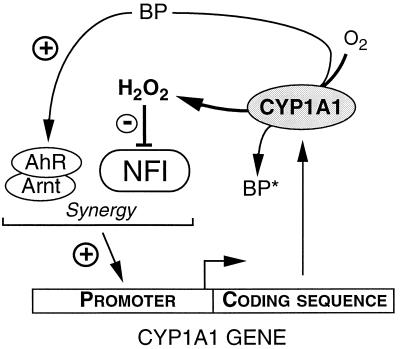
Cytochrome P450 1A1 (CYP1A1), like many monooxygenases, can produce reactive oxygen species during its catalytic cycle. Apart from the well-characterized xenobiotic-elicited induction, the regulatory mechanisms involved in the control of the steady-state activity of CYP1A1 have not been elucidated. We show here that reactive oxygen species generated from the activity of CYP1A1 limit the levels of induced CYP1A1 mRNAs. The mechanism involves the repression of the CYP1A1 gene promoter activity in a negative-feedback autoregulatory loop. Indeed, increasing the CYP1A1 activity by transfecting CYP1A1 expression vectors into hepatoma cells elicited an oxidative stress and led to the repression of a reporter gene driven by the CYP1A1 gene promoter. This negative autoregulation is abolished by ellipticine (an inhibitor of CYP1A1) and by catalase (which catalyzes H(2)O(2) catabolism), thus implying that H(2)O(2) is an intermediate. Down-regulation is also abolished by the mutation of the proximal nuclear factor I (NFI) site in the promoter. The transactivating domain of NFI/CTF was found to act in synergy with the arylhydrocarbon receptor pathway during the induction of CYP1A1 by 2,3,7,8-tetrachloro-p-dibenzodioxin. Using an NFI/CTF-Gal4 fusion, we show that NFI/CTF transactivating function is decreased by a high activity of CYP1A1. This regulation is also abolished by catalase or ellipticine. Consistently, the transactivating function of NFI/CTF is repressed in cells treated with H(2)O(2), a novel finding indicating that the transactivating domain of a transcription factor can be targeted by oxidative stress. In conclusion, an autoregulatory loop leads to the fine tuning of the CYP1A1 gene expression through the down-regulation of NFI activity by CYP1A1-based H(2)O(2) production. This mechanism allows a limitation of the potentially toxic CYP1A1 activity within the cell.


Figures

FIG. 1
FIG. 1
Intracellular H2O2 generation by CYP1A1 activity. H2O2 levels within HepG2 cells were assayed as described in the Materials and Methods section. Cells were cultured for 30 h with or without addition of ellipticine (10 μM) or catalase (200 U/ml). Plates were then read in a fluorometer, and fluorescence was expressed in arbitrary units. Results were expressed as means ± standard errors of the means (n = 6), normalized to 100% for control cells. Statistical differences from values for the control are marked with double asterisks (P < 0.01). (A) Assay of the H2O2 produced following the induction of the endogenous CYP1A1 by BP (2.5 μM). (B) Assay of the H2O2 produced following the transfection of a CYP1A1 expression vector (pRSV-1A1). Control cells were transfected with pRSV/MCS.
FIG. 2
FIG. 2
Limitation of level of CYP1A1 mRNAs induced by CYP1A1 activity. Northern blots were prepared by using 20 μg of HepG2 cell mRNAs in each lane and probed with a labeled human CYP1A1 cDNA. Cells were treated for 72 h with the compounds mentioned below. After 36 h, the culture medium was changed and the treatment was resumed. BP (2.5 μM) was used in order to induce CYP1A1 mRNAs. (A) In addition to BP, the indicated concentrations of catalase were added to the culture medium. (B) In addition to BP, ellipticine (10 μM) was added, or not, to the culture medium.
FIG. 3
FIG. 3
Autoregulation of CYP1A1 (basal activity). HepG2 cells were transfected with the p1A1-FL reporter plasmid (2 μg). (A) Structure of the 1.6-kb-long human CYP1A1 promoter used in transfection experiments (p1A1-FL vector). (B) Effect of the expression of CYP1A1 on the basal activity of the CYP1A1 promoter. In order to express the CYP1A1 protein, cells were cotransfected with 4 μg of the pRSV-1A1 expression vector (gray bars). In control cells (open bars), the same plasmid lacking the CYP1A1 cDNA (pRSV/MCS) was transfected in order to have an equivalent amount of total transfected DNA. All the cells were cotransfected with pαglob-RL (1 μg) as an internal control. Results were expressed as the means ± standard errors of the means for the quotient of firefly luciferase activity and Renilla luciferase activity (n = 10), normalized to 100% for control cells transfected with pRSV/MCS. A statistical difference between pRSV/MCS and pRSV-1A1 for the same condition is marked with a double asterisk (P < 0.0001).
FIG. 4
FIG. 4
Autoregulation of CYP1A1 (BP-induced activity). HepG2 cells were transfected with the p1A1-FL plasmid (2 μg). In order to express the CYP1A1 protein, cells were cotransfected with 4 μg of the pRSV-1A1 expression vector (gray bars). In control cells (open bars), the same plasmid lacking the CYP1A1 cDNA (pRSV/MCS) was transfected in order to have an equivalent amount of total transfected DNA. All cells were cotransfected with pαglob-RL (1 μg) as an internal control. Results were expressed as the means ± standard errors of the means for the quotient of firefly luciferase activity and Renilla luciferase activity (n = 10), normalized to 100% for control cells transfected with pRSV/MCS. A statistical difference between pRSV/MCS and pRSV-1A1 for the same condition is marked with a double asterisk (P < 0.0001). All cells were treated by BP (2.5 μM) for 24 h before harvest. C, control cells; pLacI, cells cotransfected with the pLacI plasmid (1 μg); Catalase, cells treated with catalase (100 U/ml) for 24 h; and Ellipticine, cells treated with ellipticine (10 μM) for 24 h.
FIG. 5
FIG. 5
Effect of CYP1A1 expression on the NFI-mutated CYP1A1 promoter. Cells were transfected with the p1A1-FL or the p50mut1A1-FL reporter plasmid and cotransfected with either the CYP1A1-expressing vector pRSV-1A1 (4 μg) (gray bars) or the vector pRSV/MCS (4 μg) (open bars) in order to transfect similar amounts of DNA. All cells were cotransfected with pαglob-RL (1 μg) as an internal control. Results were expressed as means ± standard errors of the means for the quotient of firefly luciferase activity and Renilla luciferase activity (n = 8), normalized to 100% for cells transfected with p1A1-FL and pRSV/MCS. A statistical difference between pRSV/MCS and pRSV-1A1 for the same condition is marked with a double asterisk (P < 0.0001).
FIG. 6
FIG. 6
The transactivating function of NFI/CTF is altered by CYP1A1 activity. (A) Structure of the promoter driving the reporter gene in the pG5-FL plasmid. (B) Activity driven by the TAD of NFI/CTF. Cells were cotransfected with the pG5-FL (1.75 μg) reporter vector and 2.5 μg of the pRSV.Gal.CTF vector expressing a Gal-TAD fusion protein (see the Materials and Methods section). Cells were cotransfected with 3 μg of either the CYP1A1 expression vector pCMV-1A1 (gray bars) or the empty pCMV/MCS vector (open bars). All cells were cotransfected with pαglob-RL (0.75 μg) as an internal control. Cells were untreated or treated with BP (2.5 μM) for 40 h. In addition, cell were treated with catalase (100 U/ml) (lanes 5 to 8) or ellipticine (10 μM) (lanes 9 to 12) for 40 h. Dimethyl sulfoxide vehicle (0.5% [vol/vol] final concentration) did not significantly change the expression of the reporter gene. Results were expressed as means ± standard errors of the means for the quotient of firefly luciferase activity and Renilla luciferase activity (n > 8), normalized to 100% for control cells transfected with pCMV/MCS. For each group of results (lanes 1 to 4, 5 to 8, and 9 to 12), values were compared to that for the corresponding pCMV/MCS-transfected control (lane 1, 5, and 9, respectively), and only differences that are statistically significant are marked with double asterisks (P < 0.001).
FIG. 7
FIG. 7
Comparison of the sensitivities of the TADs of NFI/CTF, Sp1, and Oct. Cells were cotransfected with the pG5-FL (1.75 μg) reporter vector and 2.5 μg of either pRSV.Gal.CTF, pRSV.Gal.Sp1, or pRSV.Gal.Oct (see the Materials and Methods section). All cells were cotransfected with pαglob-RL (0.75 μg) as an internal control. Results were expressed as means ± standard errors of the means for the quotient of firefly luciferase activity and Renilla luciferase activity (n > 8), normalized to 100% for control cells transfected with pRSV.Gal.CTF and pCMV/MCS. For each Gal-TAD fusion, statistical differences from the untreated pRSV/MCS-transfected control cells are marked with an asterisk (P < 0.01) or a double asterisk (P < 0.0001). (A) Cells were cotransfected with either the CYP1A1-expressing vector pCMV-1A1 (3 μg) or the pCMV/MCS (3 μg) vector in order to transfect similar amounts of DNA and were treated or not with BP (2.5 μM) for 40 h. (B) Effect of oxidative stress on the TADs of NFI/CTF, Sp1, and Oct. Cells were treated or not with H2O2 (17.5 μM) for 16 h.
FIG. 8
FIG. 8
Synergistic effect of TCDD signaling and NFI/CTF. (A) Structure of the promoter driving the reporter gene in the pXRE3G5-FL plasmid. (B) Cells were transfected with the pXRE3G5-FL reporter vector (2.5 μg) and with 3 μg of either pRSV.Gal.CTF, pRSV.Gal.Sp1, pRSV.Gal.Oct (see the Materials and Methods section), or pRSV/MCS. All cells were cotransfected with pαglob-RL (1 μg) as an internal control. Cells were left untreated or treated with TCDD (3 nM, and/or H2O2 (50 μM) for 16 h. Results were expressed as means ± standard errors of the means for the quotient of firefly luciferase activity and Renilla luciferase activity (n = 9), normalized to 100% for cells transfected with pRSV/MCS and treated with TCDD. For each Gal fusion, statistical differences between TCDD-treated cells treated with H2O2 (50 μM) and cells not treated are marked with a double asterisk (P < 0.0001).
FIG. 9
FIG. 9
Autoregulation of CYP1A1 gene expression. This scheme summarizes the autoregulatory mechanism proposed in this study. The Ah receptor (AhR), after activation by a ligand such as BP, dimerization with Arnt, and interaction with transcription factors, stimulates the CYP1A1 gene promoter. The interaction with NFI leads to a synergistic effect on transcription. This leads to the synthesis of the enzyme. CYP1A1 enzymatic activity generates H2O2, especially in the presence of uncoupled substrates such as BP (which can be converted into a metabolite [BP*]). H2O2 then alters NFI function, mainly at the level of its TAD. In consequence, NFI loses its ability to activate the CYP1A1 gene basal promoter activity and to act in synergy with the AhR signaling, which limits the expression of the CYP1A1 enzyme.

References

    1. Abdel-Razzak Z, Corcos L, Fautrel A, Campion J-P, Guillouzo A. Transforming growth factor-β1 down-regulates basal and polycyclic aromatic hydrocarbon-induced cytochromes P-450 1A1 and 1A2 in adult human hepatocytes in primary culture. Mol Pharmacol. 1994;46:1100–1110. - PubMed
    1. Alevizopoulos A, Dusserre Y, Tsai-Pflugfelder M, von der Weid T, Wahli W, Mermod N. A proline-rich TGF-β-responsive transcriptional activator interacts with histone H3. Genes Dev. 1995;9:3051–3066. - PubMed
    1. Barker C W, Fagan J B, Pasco D S. Down-regulation of P450 1A1 and 1A2 mRNA expression in isolated hepatocytes by oxidative stress. J Biol Chem. 1994;269:3985–3990. - PubMed
    1. Barker C W, Fagan J B, Pasco D S. Interleukin-1β suppresses the induction of P4501A1 and P4501A2 mRNAs in isolated hepatocytes. J Biol Chem. 1992;267:8050–8055. - PubMed
    1. Bondy S C, Naderi S. Contribution of hepatic cytochrome P450 systems to the generation of reactive oxygen species. Biochem Pharmacol. 1994;48:155–159. - PubMed

Publication types

MeSH terms

LinkOut - more resources