. 1999 Oct;58(10):623-9.
doi: 10.1136/ard.58.10.623.

Ro/SSA and La/SSB specific IgA autoantibodies in serum of patients with Sjögren's syndrome and systemic lupus erythematosus

Affiliations

Ro/SSA and La/SSB specific IgA autoantibodies in serum of patients with Sjögren's syndrome and systemic lupus erythematosus

N Pourmand et al. Ann Rheum Dis. 1999 Oct.

Abstract

Objective: To investigate the occurrence of IgA autoantibodies to Ro 52 kDa, Ro 60 kDa and La antigen in serum of patients with primary Sjögren's syndrome (pSS) and systemic lupus erythematosus (SLE).

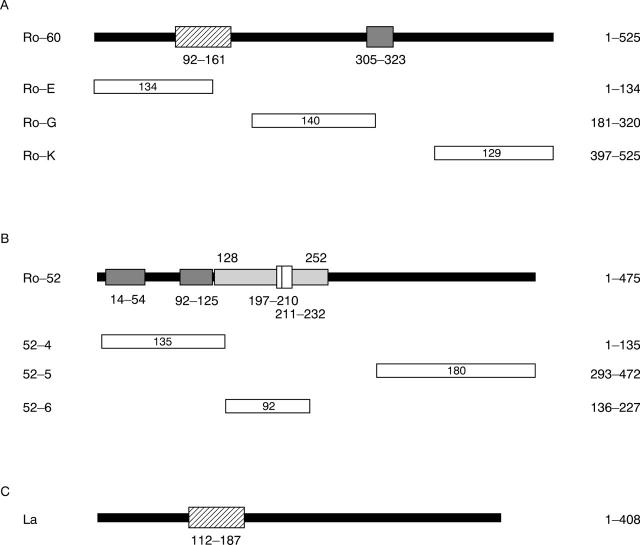
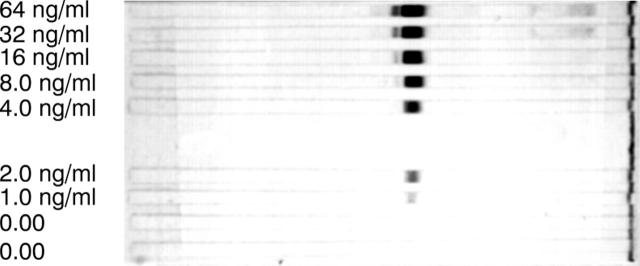
Methods: Recombinant Ro 52 kDa, Ro 60 kDa and La antigens were used to analyse autoantibodies in serum from 25 patients with pSS, 30 patients with SLE and 20 controls using a semiquantitative immunoblotting approach.

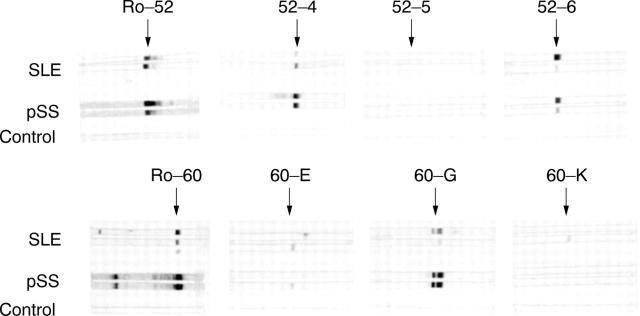
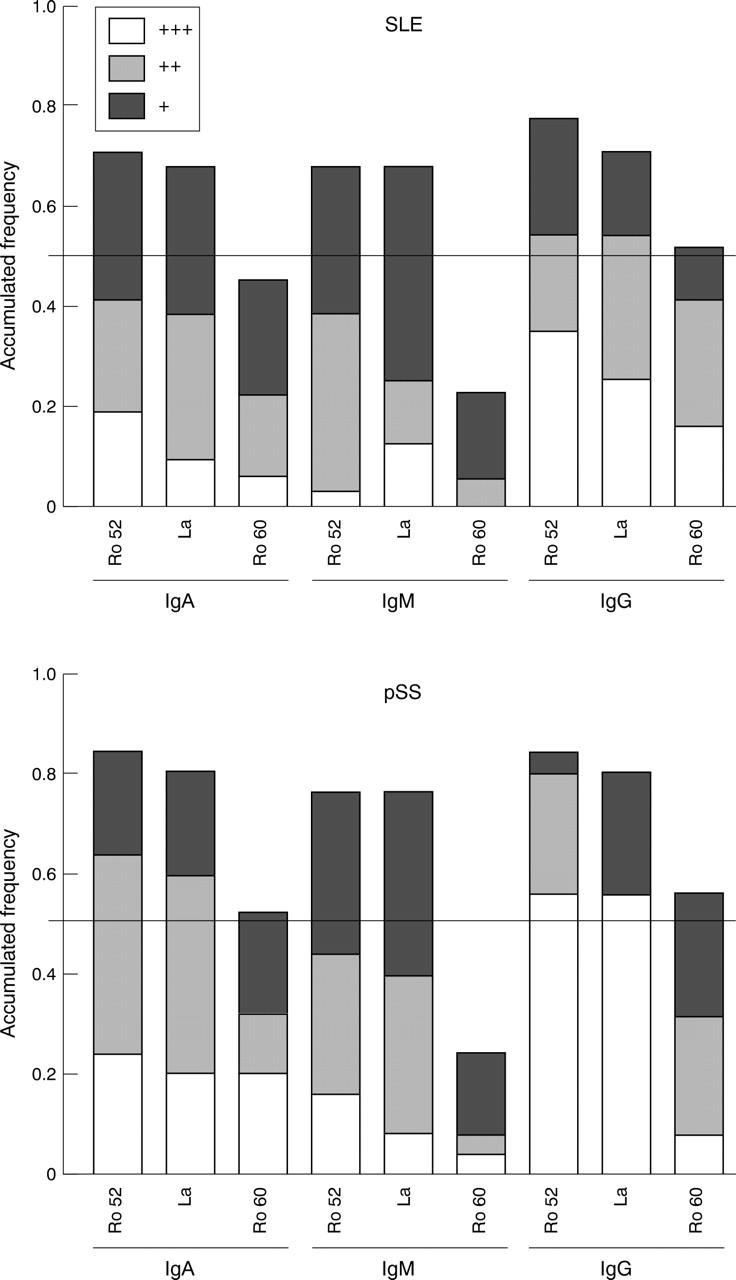
Results: Among the patients with pSS, 21 (84%) had detectable IgA autoantibodies to Ro 52 kDa, 13 (52%) to Ro 60 kDa and 20 (80%) to La antigen. The corresponding results for the patients with SLE were 22 (73%), 14 (47%) and 20 (67%), respectively. No IgA autoantibodies against the three antigens were detected in 20 normal controls. A comparison of several clinical features with the titres of IgA antibodies to Ro 52 kDa, Ro 60 kDa and La, revealed a significant relation between IgA anti-Ro 52 and IgA anti-La to sicca (p< 0.05). Semiquantitative data suggest that IgG is the dominating antibody to the three antigens followed by IgM > IgA in both SLE and pSS patients. Specificity studies of IgA autoantibodies with different subfragments of Ro 52 kDa and Ro 60 kDa antigens showed that IgA antibodies did not differ from IgG and IgM in their recognition pattern.

Conclusion: These results suggest that besides IgM and IgG, IgA autoantibodies are also detected at high frequency in patients with pSS and SLE. Further studies are necessary to evaluate the contribution of these IgA autoantibodies to inflammation as well as their diagnostic value.


Figures

Figure 1
Figure 1
Schematic representation of Ro 60 kDa, Ro 52 kDa and La proteins. The hatched boxes indicate the position of RNA binding domains, the dark grey boxes indicate the position of Cys/His clusters and the grey box represents the hydrophilic putative alpha-helical region with an incomplete and a complete leucin zipper indicated by open boxes. Amino acid positions are indicated by numbers. The number of amino acid residues encoded by each clone is indicated inside the corresponding open bar. The position of the clones relative to the deduced Ro 52 kDa, Ro 60 kDa and La amino acid sequence is indicated to the right. (A) Ro 60 kDa protein and three subclones. (B) Ro 52 kDa protein and three subclones. (C) La protein.
Figure 2
Figure 2
Illustration of the use of chimeric IgA anti-NIP antibodies to semiquantify immunoblotting data. BSA-NIP conjugate was separated on SDS-PAGE and transferred to a blotting membrane. After incubation with different concentrations of IgA anti-NIP antibodies (0-64 ng/ml) the membrane was incubated with anti-IgA enzyme conjugate and developed with BCIP/NBT for 30 minutes.
Figure 3
Figure 3
Representative recognition pattern of IgA anti-Ro 52 kDa and anti-Ro 60 kDa antibodies to six subfragments in two patients with SLE, two with pSS and one control.
Figure 4
Figure 4
Frequency of serum IgG, IgA and IgM autoantibodies to Ro 60 kDa, Ro 52 kDa and La proteins in pSS and SLE patients by immunoblotting. The intensity of the signal in immunoblotting was semiquantified in relation to serial dilutions of chimeric anti-NIP antibody results. The following groups were established; for IgA 0.25-0.5 µg/ml (+), 0.5-1.0 µg/ml (++) and > 1.0 µg/ml (+++); for IgM 1.50-3.0 µg/ml (+), 3.0-6.0 µg/ml (++) and > 6.0 µg/ml (+++); for IgG 2.0-4.0 µg/ml (+), 4.0-8.0 µg/ml (++) and > 8.0 µg/ml (+++). The horizontal lines indicates median values.

References

    1. Mol Cell Biol. 1981 Dec;1(12):1138-49 - PubMed
    1. Clin Exp Immunol. 1999 Jan;115(1):208-13 - PubMed
    1. Biochem Biophys Res Commun. 1982 Sep 16;108(1):363-70 - PubMed
    1. Am J Med. 1983 Jan;74(1):56-63 - PubMed
    1. Clin Immunol Immunopathol. 1983 Mar;26(3):390-7 - PubMed

Publication types