. 1999 Sep 20;146(6):1211-26.
doi: 10.1083/jcb.146.6.1211.

Nuclear organization of mammalian genomes. Polar chromosome territories build up functionally distinct higher order compartments

Affiliations

Nuclear organization of mammalian genomes. Polar chromosome territories build up functionally distinct higher order compartments

N Sadoni et al. J Cell Biol. .

Abstract

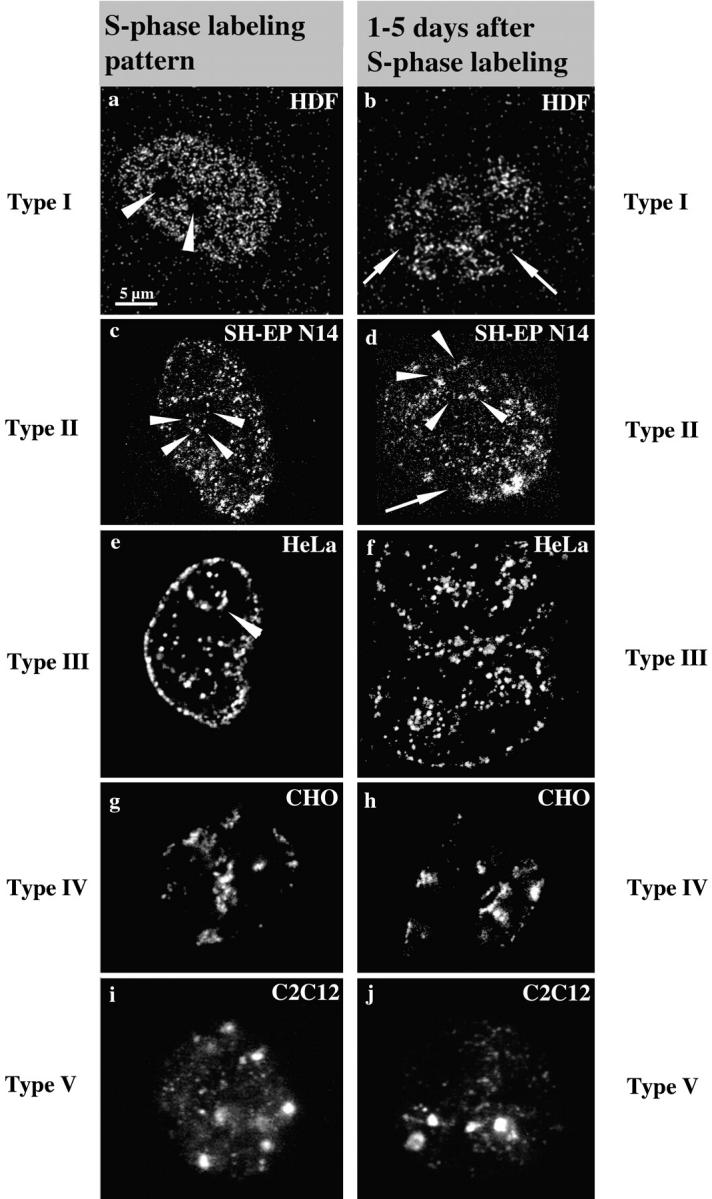
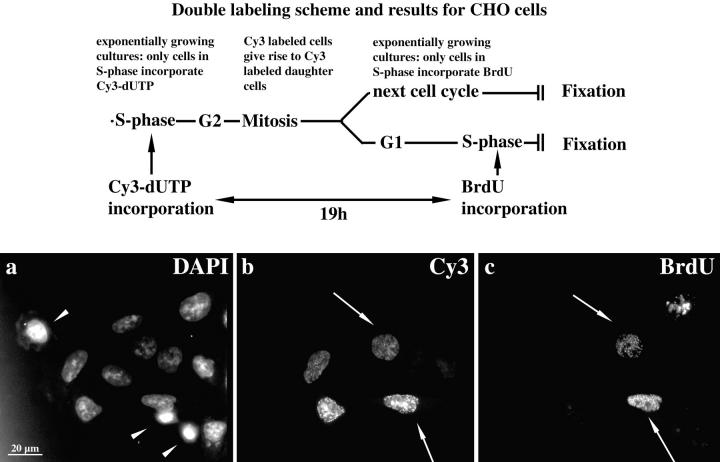
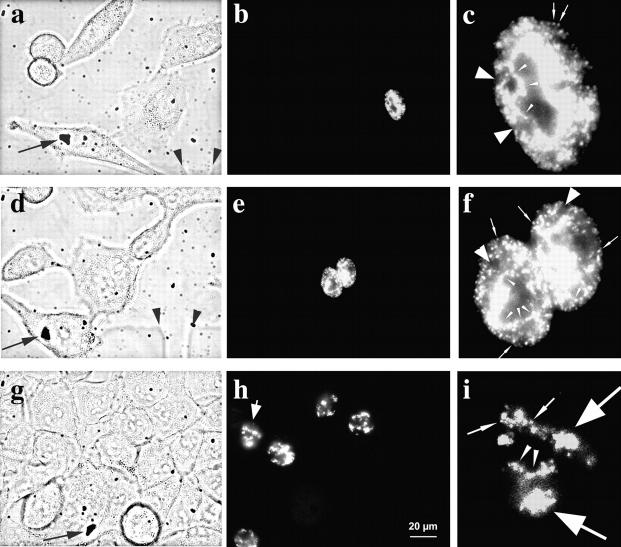
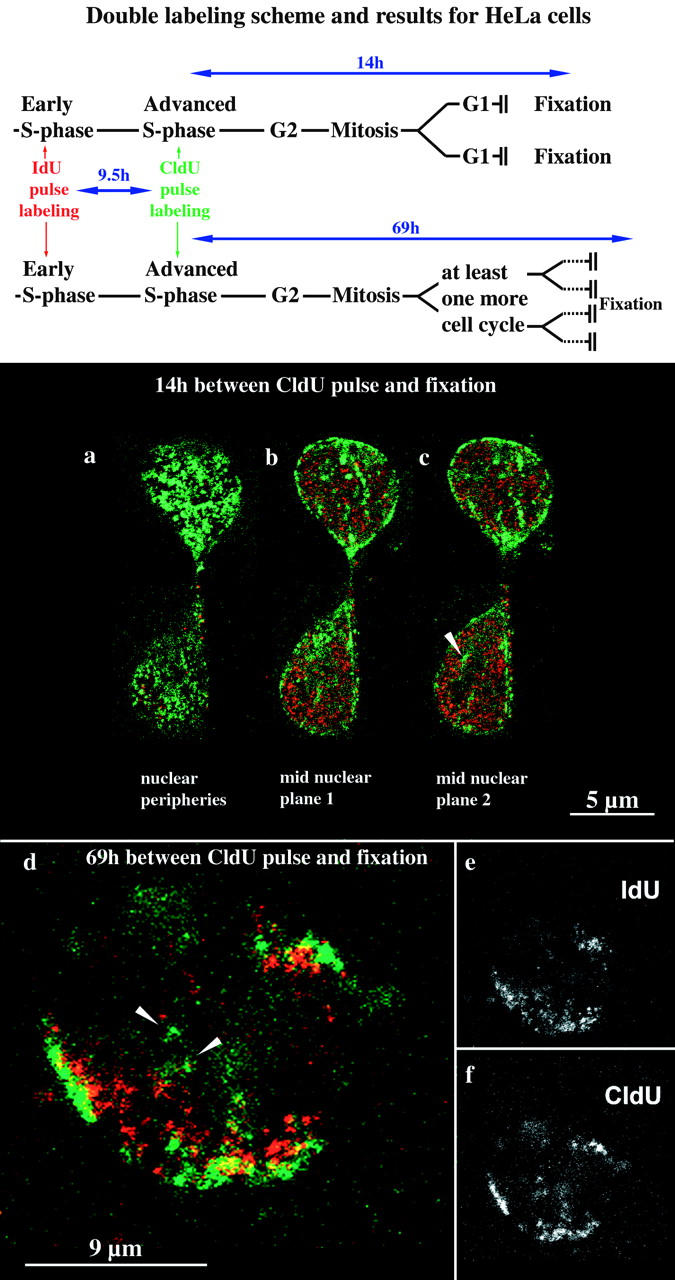
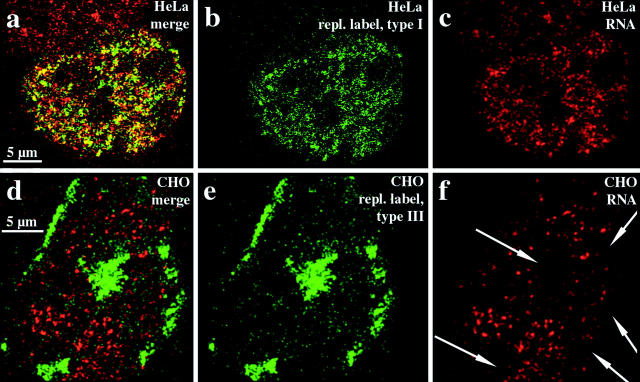
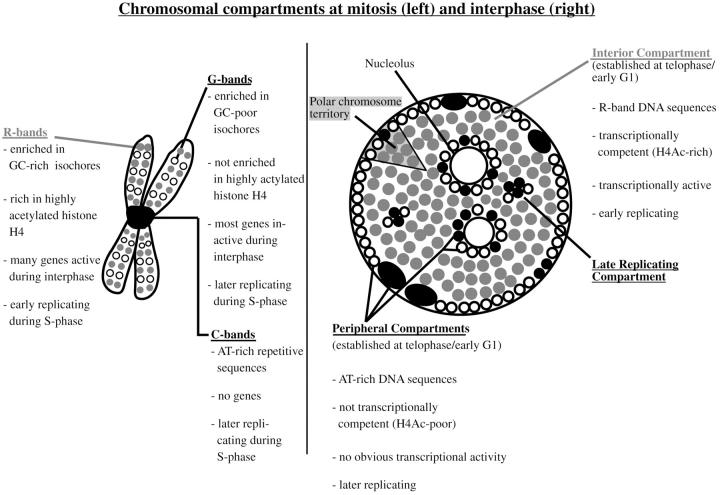
We investigated the nuclear higher order compartmentalization of chromatin according to its replication timing (Ferreira et al. 1997) and the relations of this compartmentalization to chromosome structure and the spatial organization of transcription. Our aim was to provide a comprehensive and integrated view on the relations between chromosome structure and functional nuclear architecture. Using different mammalian cell types, we show that distinct higher order compartments whose DNA displays a specific replication timing are stably maintained during all interphase stages. The organizational principle is clonally inherited. We directly demonstrate the presence of polar chromosome territories that align to build up higher order compartments, as previously suggested (Ferreira et al. 1997). Polar chromosome territories display a specific orientation of early and late replicating subregions that correspond to R- or G/C-bands of mitotic chromosomes. Higher order compartments containing G/C-bands replicating during the second half of the S phase display no transcriptional activity detectable by BrUTP pulse labeling and show no evidence of transcriptional competence. Transcriptionally competent and active chromatin is confined to a coherent compartment within the nuclear interior that comprises early replicating R-band sequences. As a whole, the data provide an integrated view on chromosome structure, nuclear higher order compartmentalization, and their relation to the spatial organization of functional nuclear processes.


Figures

Figure 1
Figure 1
S phase replication labeling patterns are preserved. Cells ([a and b] Hv, human diploid fibroblasts; [c and d] SH-EP N14 human neuroblastoma cells; [e and f] HeLa cells; [g and h] CHO cells; and [i and j] C2C12 mouse myoblasts) were replication-labeled with BrdU (a–d, i, and j; 30-min pulses) or Cy3-dUTP (e–h). Cells were fixed immediately after BrdU labeling or 30 min after microinjection of Cy3-dUTP to obtain labeled S phase cells (left, a, c, e, g, and i). S phase cells display the typical replication labeling patterns (indicated on the left, for classification see text): (a) type I, (c) type II, (e) type III, (g) type IV, and (i) type V. Similarly labeled cells were grown for 1–5 d after labeling and fixed after this growth period (right, b, d, f, h, and j). The presence of similar patterns (types indicated on the right) several days after S phase labeling suggests that DNA replicating with a particular timing during S phase always occupies similar nuclear positions. Arrowheads in a mark the nucleoli that are always unlabeled. Arrowheads in c–e mark perinucleolar label. Arrows in b and d indicate unlabeled chromosome territories. The presence of unlabeled territories demonstrates that cells do not display similar patterns because they stopped cycling, but rather that they went through at least two mitoses after labeling (compare Fig. 3). Note also the two very close nuclei in f displaying similar type III patterns, suggesting that similar patterns were conserved in sister nuclei after cell division (compare Fig. 4, a–c). All pictures display single light optical sections through midnuclear planes except i and j, which show epifluorescence images. Bar in a is similar for all images.
Figure 2
Figure 2
Genome compartmentalization is similar during all interphase stages. The applied double labeling procedure is schematically drawn at the top. Typical replication labeling patterns were obtained by incorporation of Cy3-dUTP into the DNA of the S phase cells of exponentially growing CHO cultures. 19 h after Cy3-dUTP microinjection, cultures were replication-labeled with BrdU and fixed after 30 min. Cells in S phase at the time point of fixation (BrdU-labeled) can be distinguished from G1 and G2 cells (not BrdU-labeled). The DAPI staining is shown in a (a–c, same field of cells is imaged). Mitotic stages of exponentially growing cultures are indicated by arrowheads. Cy3-labeled cells are depicted in b. Note the two pairs of cells with similar labeling intensities and labeling patterns (upper pair, type I; lower pair, type III; blurred label is due to epifluorescent imaging). Cells of one pair are likely sister cells (compare Fig. 4). The right cells of each pair were in S phase at the time point of fixation (arrows) as indicated by the BrdU label depicted in c. Cy3 labeling patterns are similar in S phase and non-S phase cells.
Figure 3
Figure 3
Clonal inheritance of replication labeling patterns. HeLa cells were grown on a gridded cellocate coverslip and the same area (bar in h) was imaged on three consecutive days (a–c, day 1; d–f, day 2; g–i, day 3; a, d, and g, phase-contrast; b, e, and h, Cy3-detection; and c, f, and i, enlarged Cy3-labeled nuclei). Similarity of the imaged areas is indicated by the grid (arrowheads in a and d) and a piece of debris attached to one cell (arrows in a, d, and g). 8 h after microinjection of Cy3-dUTP (a–c), one cell within the imaged area is labeled. An enlargement of the cell shown in b is depicted in c. The cell displays a type II pattern: the perinucleolar region is labeled (small arrowheads) while small foci (arrows) are distributed over broader nucleoplasmic areas although some areas are excluded (large arrowheads). Note that small foci in areas where the nuclei are particularly thick cannot be resolved by epifluorescence microscopy and appear as uniformly brightly stained areas (confocal imaging was not compatible with this type of living cell study). Overnight the cell divided and on the next day (d–f) two daughter cells display a type II pattern. An enlargement of the cells depicted in e is shown in f (small arrowheads, perinucleolar label; large arrowheads, unlabeled regions; and arrows, small nucleoplasmic foci). Each of the daughter cells divided to give rise to four granddaughter cells on the next day (g–i). At the second mitosis after initial labeling, labeled and unlabeled chromatids segregate (Taylor 1984) giving rise to nuclei containing approximately equal amounts of labeled and unlabeled chromosome territories visible as stained or unstained patches within the nuclei depicted in h. Although the pattern appears different because of the presence of unlabeled territories the enlargement (i, nucleus indicated by an arrow in h) still shows a typical type II pattern with foci enriched along the boundary of a nucleolus (arrowheads) as well as distributed over broader nucleoplasmic areas. These foci belong to particular chromosome territories within the nucleoplasm (large arrows). Epifluorescence microscopy resolves the focal substructure of territories (Zink et al. 1998) only where territories are relatively flat (small arrows).
Figure 4
Figure 4
Establishment of higher order nuclear compartments after mitosis and the underlying chromosomal structure. HeLa S6 cells synchronized in early S phase were labeled for 30 min with IdU and 9.5 h later for 30 min with CldU (see labeling scheme at the top). Therefore, initially labeled cells simultaneously displayed a type I pattern labeled by IdU and a pattern typical for the second half of S phase labeled by CldU. Daughter cells of the initially labeled cells were fixed 14 (a–c) or 69 h (d–f), respectively, after the CldU pulse and analyzed by confocal microscopy. Identical nuclear planes were imaged regarding TRITC (IdU detection, depicted in red) and FITC (CldU detection, depicted in green) fluorescence. The corresponding merged TRITC and FITC signals (colocalizing signals appear yellow) are shown in a–d. e and f display only the TRITC (e) or FITC (f) signals of the merged image in d (midnuclear plane). The two cells depicted in a–c display the typical morphology of early G1 cells shortly after mitosis. Both G1 cells display an IdU (red) type I pattern and a CldU (green) type III pattern present in their mother cell. Perinucleolar labeling is indicated by an arrowhead in c. After 69 h (d–f), initially labeled cells went through at least two mitoses as indicated by the presence of single-labeled chromosome territories (double-labeled patches within the nucleus depicted in d). Double-labeled chromosome territories reveal that the nuclear type I (IdU, red) and type III patterns are due to a reproducibly distinct distribution of IdU- and CldU-labeled DNA within single chromosome territories. CldU-labeled DNA is concentrated at subchromosomal positions near the nuclear and nucleolar peripheries, whereas IdU-labeled DNA is located at subchromosomal positions between these compartments.
Figure 5
Figure 5
Hybridization of DNA from the H3 isochore fraction to human metaphase spreads. FISH with DNA from the H3 isochore fraction as a probe (FITC-detected) was performed on metaphase spreads from male human lymphocytes. Chromosomes were DAPI-banded and arranged into standard karyograms. The inverted DAPI image (a) displays G- and C-bands more darkly stained compared with R-bands. Most of the R-bands hybridized specifically to the DNA probe as the inverted image of the hybridization signals shows (b, FITC fluorescence appears dark) that displays a typical R banding pattern. Note the different signal intensities of distinct R-bands (e.g., on the distal p-arm of chromosome 1 and the q-arm of chromosome 13).
Figure 6
Figure 6
R-band DNA is confined to the interior compartment during interphase. Nuclei (a–c, HeLa S6 nucleus; and d–f, three different nuclei from SH-EP N14 cells) were replication-labeled with Cy3-dUTP (replication patterns depicted in red). DNA from the H3 isochore fraction (FITC-detected, depicted in green) was hybridized to Cy3-labeled nuclei. Nuclei were analyzed by confocal microscopy. For each nucleus, identical midnuclear planes are shown regarding FITC or Cy3 fluorescence detection (colocalizing FITC and Cy3 fluorescence appears yellow on merged [b and d–f] images). Regarding the HeLa nucleus, the merge (b) of the hybridization signal (a) and the type I replication pattern (c) reveals the localization of R-band sequences within the interior compartment. A similar localization of R-band sequences is obvious regarding SH-EP N14 cells (d, underlying type I pattern in red). R-band sequences are excluded from the peripheral (e, red, type III pattern) and late replicating (f, red, type V pattern) compartments. It should be noted that all confocal images presented were not further processed and reflect the resolution limits of light microscopy. Therefore, some colocalization of fluorescent signals at the boundaries of differently labeled distinct compartments is expected.
Figure 7
Figure 7
Hyperacetylated isoforms of histone H4 are confined to the interior compartment. Human diploid female fibroblasts (a–d, HDFs) and mouse C2C12 myoblasts (e–h) were replication-labeled with BrdU (TRITC-detected, depicted in red) for 30 min, fixed after 27 h, and immunostained with rabbit antiserum R232/8 specific for hyperacetylated histone H4 (H4Ac, FITC detected, depicted in green). a–c show light optical sections from identical midnuclear planes (b, FITC detection; c, TRITC detection; and a, merge, colocalizing FITC and TRITC signals appear yellow). Hyperacetylated histone H4 (b, FITC-detected, green) is confined to the interior compartment as the early replicating DNA (a and c, type I pattern, red). About 70% of these female HDFs display a strongly DAPI-stained domain at the nuclear periphery (arrowhead in d that is the corresponding epifluorescence DAPI image of the nucleus depicted in a–c). These domains, which likely represent the inactive X chromosome, are not immunostained by R232/8 antiserum and contain no early replicating DNA (a–c, arrowheads). The merges of single light optical sections detecting FITC (hyperacetylated histone H4, green) or TRITC (BrdU replication patterns, red) fluorescence (colocalizing FITC and TRITC signals appear yellow) of identical planes of corresponding C2C12 nuclei are shown in e–h. The nuclei display type I (e), type III (f and g), and type V (h) BrdU labeling patterns (red). Distinct focal planes of the same nucleus are depicted in f (midnuclear plane) and g (nuclear periphery). Note the concentration of R232/8 staining (green) within the interior compartment labeled by the type I pattern (e), whereas the peripheral (f and g) and late replicating (h) compartments are excluded. Note in particular, the absence of FITC fluorescence in the perinuclear region (the red rim around the nucleus in f shown by arrowheads and the red peripheral patches (segregated labeled and unlabeled territories) in g. The faint FITC signal in g is likely due to the low resolution of confocal microscopes along the optical axis.
Figure 8
Figure 8
Compartmentaliza-tion of transcriptionally competent chromatin in nuclei of CHO and HeLa S6 cells. Nuclei were replication-labeled with Cy3-dUTP (depicted in red). Cells were fixed and immunostained with R232/8 antiserum (FITC-detected, depicted in green) 23 (a–f, j, and k) or 1 h (g–i, l) after replication labeling. a–i display images of CHO nuclei, whereas j–l show HeLa S6 nuclei. For each nucleus, single light optical sections of identical midnuclear planes regarding Cy3 and FITC fluorescence detection are shown. For all distinct nuclei (a–c, d–f, g–i, and j and k or l correspond to one nucleus) the FITC (c, f, and i), Cy3 (b, e, and h) and merged signals (a, d, and g) are shown except for j–l where only the merged signals of different nuclei are depicted. Colocalizing FITC and Cy3 signals appear yellow on merged images. Chromatin enriched in highly acetylated isoforms of histone H4 (H4Ac), indicated by R232/8 staining (green), is concentrated in the interior compartment (a, b, and j, colocalizing with the type I pattern, red). R232/8 staining is excluded from the peripheral and late replicating compartments (d, e, g, h, k, and l, replication-labeled, red).
Figure 9
Figure 9
Transcriptional activity is confined to the interior compartment. Transcriptional activity within distinct genome compartments was investigated by BrUTP pulse labeling (10 min) of cells replication-labeled on the previous day. BrUTP was detected with TRITC fluorescence, whereas replication labeling was performed with FITC-dUTP. HeLa cells (a–c) and CHO cells (d–f) were investigated. Identical nuclear planes were imaged with regard to FITC detection (b and e, depicted in green) and TRITC detection (c and f, depicted in red). Merges of corresponding FITC and TRITC signals are depicted in a and d (colocalizing signals appear yellow). Transcriptional activity, indicated by BrUTP incorporation into nascent RNA (c and f, and, a and d, red) is confined to the interior compartment (a and b, green, colocalizing with the type I pattern). The TRITC signal in the upper left regions of a and c is due to an adjacent BrUTP-labeled nucleus that is not replication-labeled. d–f depict the exclusion of RNA synthesis from the peripheral compartments (d and e, green). Arrows in f show examples of perinuclear and perinucleolar regions strongly labeled by the type III replication labeling pattern (d and e, green) that display no TRITC signal (no RNA synthesis).
Figure 10
Figure 10
The scheme summarizes previous results and the data of the present paper regarding compartmentalization of mammalian genomes during mitosis and interphase. The well characterized bands of mitotic chromosomes give rise to distinct higher order functional compartments within the cell nucleus. Distinct bands of mitotic chromosomes differ in a variety of features as isochore composition and corresponding DNA sequence composition (Bickmore and Sumner 1989; Craig and Bickmore 1993; Bernardi 1995), gene content (Bickmore and Sumner 1989; Craig and Bickmore 1993; Bernardi 1995; Cross et al. 1997), acetylation levels of histone H4 (Jeppesen and Turner 1993), transcriptional activity of genes (Craig and Bickmore 1993, Craig and Bickmore 1994), and replication timing during interphase (Dutrillaux et al. 1976; Camargo and Cervenka 1982). Differences in DNA sequence composition (Rae and Franke 1972; Manuelidis and Borden 1988; O'Keefe et al. 1992), acetylation levels of histone H4 (acetylated histone H4 designated as H4Ac), transcriptional activity, and replication timing of chromatin targeted to distinct nuclear compartments (Ferreira et al. 1997) demonstrate the functional features of these compartments and their relation to genome organization revealed by banding patterns of mitotic chromosomes. R-band sequences (symbolized by gray dots) localize to the interior compartment, whereas G- and C-band sequences localize to the peripheral and late replicating compartments (symbolized by black and open dots). In the present study, the peripheral and late replicating compartments revealed comparable properties. Higher order nuclear compartments are built up by chromosome territories displaying a distinct polarized distribution of R-band DNA and G/C-band DNA organized into corresponding subchromosomal foci (Zink et al. 1998, Zink et al. 1999).

Similar articles

Cited by

References

    1. Abney J.R., Cutler B., Fillbach M.L., Axelrod D., Scalettar B.A. Chromatin dynamics in interphase nuclei and its implications for nuclear structure. J. Cell Biol. 1997;137:1459–1468. - PMC - PubMed
    1. Andrulis E.D., Neimann A.M., Zappulla D.C., Sternglanz R. Perinuclear localization of chromatin facilitates transcriptional silencing. Nature. 1998;394:592–595. - PubMed
    1. Belmont A.S., Bignone F., Ts'o P.O.P. The relative intranuclear positions of Barr bodies in XXX non-transformed human fibroblasts. Exp. Cell Res. 1986;165:165–179. - PubMed
    1. Belmont A.S., Bruce K. Visualization of G1 chromosomesa folded, twisted, supercoiled chromonema model of interphase chromatid structure. J. Cell Biol. 1994;127:287–302. - PMC - PubMed
    1. Berezney R., Mortillaro M.J., Ma H., Wei X., Samarabandu J. The nuclear matrixa structural milieu for genomic function. Int. Rev. Cytol. 1995;162A:1–65. - PubMed

Publication types

MeSH terms