. 1999 Sep;104(6):721-32.
doi: 10.1172/JCI6890.

Allergic lung responses are increased in prostaglandin H synthase-deficient mice

Affiliations

Allergic lung responses are increased in prostaglandin H synthase-deficient mice

S H Gavett et al. J Clin Invest. 1999 Sep.

Abstract

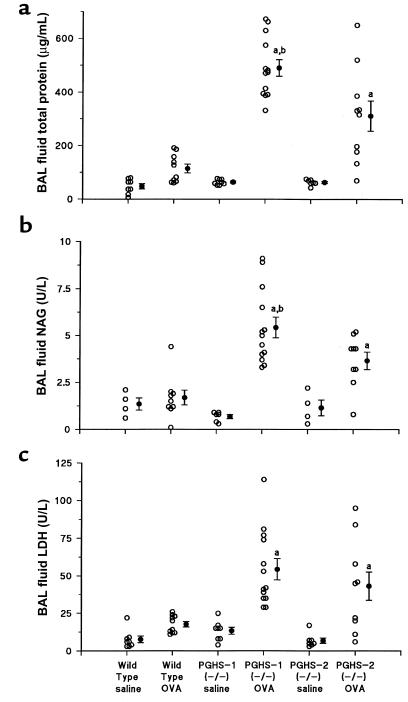
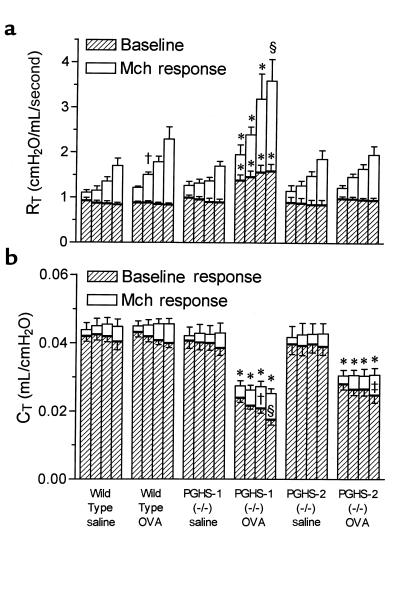
To investigate the function of prostaglandin H synthase-1 and synthase-2 (PGHS-1 and PGHS-2) in the normal lung and in allergic lung responses, we examined allergen-induced pulmonary inflammation and airway hyperresponsiveness in wild-type mice and in PGHS-1(-/-) and PGHS-2(-/-) mice. Among nonimmunized saline-exposed groups, we found no significant differences in lung function or histopathology, although PGE(2) was dramatically reduced in bronchoalveolar lavage (BAL) fluid from PGHS-1(-/-) mice, relative to wild-type or PGHS-2(-/-) mice. After ovalbumin sensitization and challenge, lung inflammatory indices (BAL cells, proteins, IgE, lung histopathology) were significantly greater in PGHS-1(-/-) mice compared with PGHS-2(-/-) mice, and both were far greater than in wild-type mice, as illustrated by the ratio of eosinophils in BAL fluid (8:5:1, respectively). Both allergic PGHS-1(-/-) and PGHS-2(-/-) mice exhibited decreased baseline respiratory system compliance, whereas only allergic PGHS-1(-/-) mice showed increased baseline resistance and responsiveness to methacholine. Ovalbumin exposure caused a modest increase in lung PGHS-2 protein and a corresponding increase in BAL fluid PGE(2) in wild-type mice. We conclude that (a) PGHS-1 is the predominant enzyme that biosynthesizes PGE(2) in the normal mouse lung; (b) PGHS-1 and PGHS-2 products limit allergic lung inflammation and IgE secretion and promote normal lung function; and (c) airway inflammation can be dissociated from the development of airway hyperresponsiveness in PGHS-2(-/-) mice.


Figures

Figure 1
Figure 1
Stained cytospins of BAL fluid cells showing alveolar macrophage morphology in wild-type and PGHS-deficient mice. Wild-type, PGHS-2–/–, and PGHS-2–/– mice were administered adjuvant only and exposed to saline aerosol or sensitized with ovalbumin in adjuvant and challenged with ovalbumin aerosol. BAL cells were collected 1 day after final challenge. (a) Nonimmunized wild-type mice. (b) Allergic wild-type mice. (c) Allergic PGHS-1–/– mice. (d) Allergic PGHS-2–/– mice. ×100.
Figure 2
Figure 2
(al) Lung histopathology showing increased inflammation in PGHS-deficient mice compared with wild-type mice. (a, e, and l) Nonimmunized wild-type mice. (b and f) Allergic wild-type mice. (c, g, i, j, and k) Allergic PGHS-1–/– mice. Arrow in i indicates multinucleated giant cell. Arrow in j indicates eosinophilic crystals within macrophage. (d and h) Allergic PGHS-2–/– mice. All sections were stained with hematoxylin and eosin except k and l, which were stained with alcian blue/periodic acid-Schiff. ×10 (ad), ×40 (eh, k, and l), and ×80 (i and j).
Figure 3
Figure 3
BAL fluid proteins are increased in allergic PGHS-deficient mice compared with wild-type mice. Wild-type, PGHS-1–/–, and PGHS-2–/– mice were divided into treatment groups and BAL fluid total protein, NAG, and LDH were determined as described in Methods. Each open circle represents results from 1 animal. Filled circles and error bars show mean ± SE. (a) BAL fluid total protein. (b) BAL fluid NAG. (c) BAL fluid LDH. aP < 0.01 vs. all nonimmunized (saline) and wild-type ovalbumin (OVA) groups. bP < 0.01 vs. PGHS-2–/– OVA.
Figure 4
Figure 4
Airway responsiveness to methacholine in PGHS-deficient and wild-type mice. Wild-type, PGHS-1–/–, and PGHS-2–/– mice were divided into treatment groups as described in Figure 1. Airway responses to intravenous Mch were measured 1 day after final aerosol exposure, as described in Methods. Bars represent mean ± SE of 7–13 mice per group. (a) RT before dosing with Mch and at peak of response to 25, 50, 100, and 200 μg/kg Mch (left to right for each group). For each dose, significant differences among groups were determined for associated baselines (shown above hatched bars) and increases in RT due to Mch (shown above open bars). *P < 0.05 vs. all other groups. P < 0.05 vs. wild-type saline. §P < 0.05 vs. all groups except wild-type OVA. (b) Total respiratory system-compliance (CT), measured simultaneously with RT, before dosing with Mch and at nadir of response to Mch. For each dose, significant differences among groups were determined for associated baselines (hatched bars + open bars; shown above open bars) and decreases in CT due to Mch (shown within open bars). *P < 0.05 vs. wild-type saline, wild-type OVA, PGHS-1–/– saline, and PGHS-2–/– saline. P < 0.05 vs. PGHS-1–/– saline and PGHS-2–/– OVA. §P < 0.05 vs. wild-type OVA and PGHS-1–/– saline. P < 0.05 vs. PGHS-2–/– saline.
Figure 5
Figure 5
PGHS-1 and PGHS-2 expression in nonimmunized and allergic wild-type, PGHS-1–/–, and PGHS-2–/– mice. Wild-type, PGHS-1–/–, and PGHS-2–/– mice were divided into treatment groups, and the abundance of PGHS-1 and PGHS-2 protein in the lungs was determined by Western blotting using immunospecific antibodies as described in Methods. Results are representative of experiments with 18 different animals (3 mice in each of the 6 groups). Lane 1, PGHS-1–/– mice, allergic; lane 2, PGHS-2–/– mice, allergic; lane 3, wild type mice, allergic; lane 4, PGHS-1–/– mice, nonimmunized; lane 5, PGHS-2–/– mice, nonimmunized; lane 6, wild-type mice, nonimmunized.
Figure 6
Figure 6
BAL fluid eicosanoid levels in PGHS-deficient and wild-type mice. BAL fluid PGE2 (a) and LTB4 (b) were determined by RIA in wild-type, PGHS-1–/–, and PGHS-2–/– mice (groups described in Figure 1) as described in Methods. Each open circle represents results from 1 animal. Filled circles and error bars show mean ± SE. aP < 0.05 vs. wild-type groups and PGHS-2–/– saline groups. bP < 0.005 vs. saline-exposed wild-type and OVA-exposed PGHS-1–/– groups. cP < 0.005 vs. all other groups.
Figure 7
Figure 7
Total IgE levels in BAL fluid of PGHS-deficient and wild-type mice. Total IgE levels in BAL fluid from nonimmunized and allergic wild-type, PGHS-1–/–, and PGHS-2–/– mice were analyzed as described in Methods. Each open circle represents results from animal. Filled circles and error bars show mean ± SE. aP < 0.001 vs. all saline control groups and wild-type OVA. bP < 0.01 vs. PGHS-2–/– OVA.

References

    1. Holtzman MJ. Arachidonic acid metabolism: implications of biological chemistry for lung function and disease. Am Rev Respir Dis. 1991;143:188–203. - PubMed
    1. Wenzel SE. Arachidonic acid metabolites: mediators of inflammation in asthma. Pharmacotherapy. 1997;17:3S–12S. - PubMed
    1. Adelroth E, Morris MM, Hargreave FE, O’Byrne PM. Airway responsiveness to leukotrienes C4 and D4 and to methacholine in patients with asthma and normal controls. N Engl J Med. 1986;315:480–484. - PubMed
    1. Henderson WR, et al. The importance of leukotrienes in airway inflammation in a mouse model of asthma. J Exp Med. 1996;184:1483–1494. - PMC - PubMed
    1. Drazen JM, Israel E, O’Byrne PM. Treatment of asthma with drugs modifying the leukotriene pathway. N Engl J Med. 1999;340:197–206. - PubMed

MeSH terms