

Normal insulin-dependent activation of Akt/protein kinase B, with diminished activation of phosphoinositide 3-kinase, in muscle in type 2 diabetes
- PMID: 10491408
- PMCID: PMC408433
- DOI: 10.1172/JCI6928
Normal insulin-dependent activation of Akt/protein kinase B, with diminished activation of phosphoinositide 3-kinase, in muscle in type 2 diabetes
Abstract
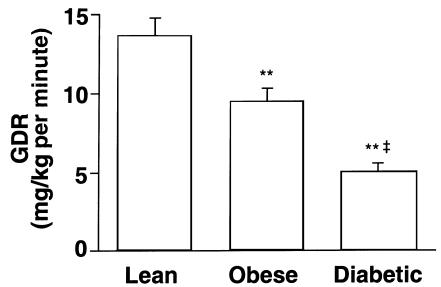
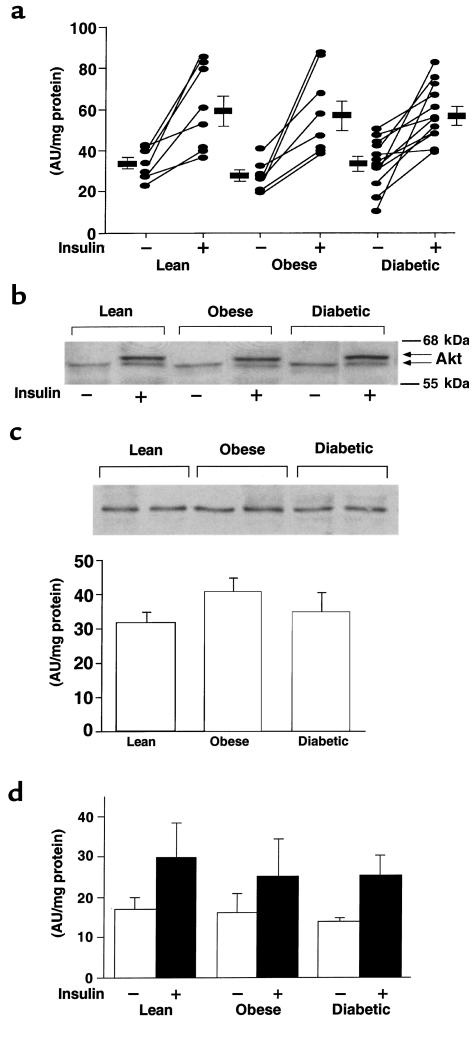
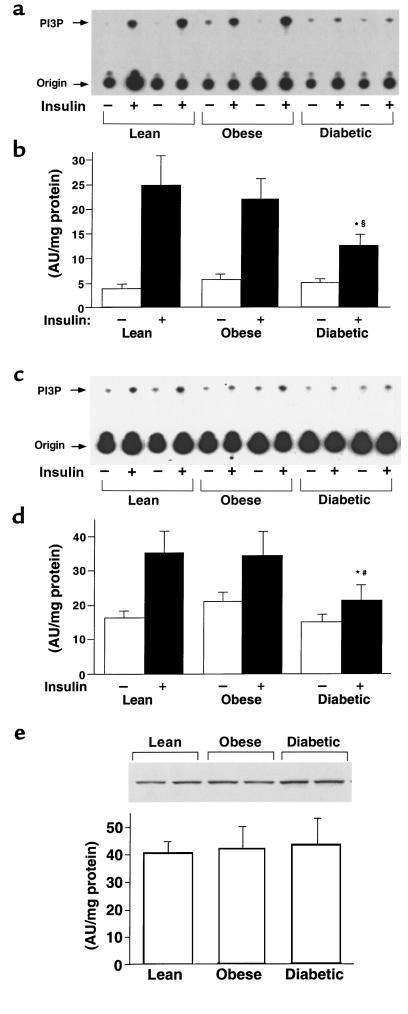
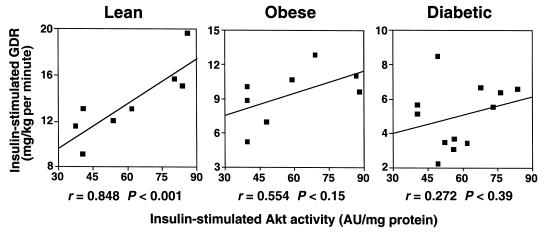
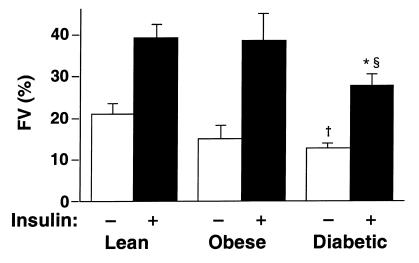
To determine whether the serine/threonine kinase Akt (also known as protein kinase B) is activated in vivo by insulin administration in humans, and whether impaired activation of Akt could play a role in insulin resistance, we measured the activity and phosphorylation of Akt isoforms in skeletal muscle from 3 groups of subjects: lean, obese nondiabetic, and obese type 2 diabetic. Vastus lateralis biopsies were taken in the basal (overnight fast) and insulin-stimulated (euglycemic clamp) states. Insulin-stimulated glucose disposal was reduced 31% in obese subjects and 63% in diabetic subjects, compared with lean subjects. Glycogen synthase (GS) activity in the basal state was reduced 28% in obese subjects and 49% in diabetic subjects, compared with lean subjects. Insulin-stimulated GS activity was reduced 30% in diabetic subjects. Insulin treatment activated the insulin receptor substrate-1-associated (IRS-1-associated) phosphoinositide 3-kinase (PI 3-kinase) 6.1-fold in lean, 3.7-fold in obese, and 2.4-fold in diabetic subjects. Insulin also stimulated IRS-2-associated PI 3-kinase activity 2.2-fold in lean subjects, but only 1.4-fold in diabetic subjects. Basal activity of Akt1/Akt2 (Akt1/2) and Akt3 was similar in all groups. Insulin increased Akt1/2 activity 1.7- to 2. 0-fold, and tended to activate Akt3, in all groups. Insulin-stimulated phosphorylation of Akt1/2 was normal in obese and diabetic subjects. In lean subjects only, insulin-stimulated Akt1/2 activity correlated with glucose disposal rate. Thus, insulin activation of Akt isoforms is normal in muscle of obese nondiabetic and obese diabetic subjects, despite decreases of approximately 50% and 39% in IRS-1- and IRS-2-associated PI 3-kinase activity, respectively, in obese diabetic subjects. It is therefore unlikely that Akt plays a major role in the resistance to insulin action on glucose disposal or GS activation that is observed in muscle of obese type 2 diabetic subjects.
Figures
Comment in
-
Closing in on the cause of insulin resistance and type 2 diabetes.J Clin Invest. 1999 Sep;104(6):675-6. doi: 10.1172/JCI8216. J Clin Invest. 1999. PMID: 10491401 Free PMC article. No abstract available.
Similar articles
-
Insulin-stimulated protein kinase C lambda/zeta activity is reduced in skeletal muscle of humans with obesity and type 2 diabetes: reversal with weight reduction.Diabetes. 2003 Aug;52(8):1935-42. doi: 10.2337/diabetes.52.8.1935. Diabetes. 2003. PMID: 12882908
-
In vivo activation of ROCK1 by insulin is impaired in skeletal muscle of humans with type 2 diabetes.Am J Physiol Endocrinol Metab. 2011 Mar;300(3):E536-42. doi: 10.1152/ajpendo.00538.2010. Epub 2010 Dec 28. Am J Physiol Endocrinol Metab. 2011. PMID: 21189360 Free PMC article.
-
Divergent regulation of Akt1 and Akt2 isoforms in insulin target tissues of obese Zucker rats.Diabetes. 2000 May;49(5):847-56. doi: 10.2337/diabetes.49.5.847. Diabetes. 2000. PMID: 10905496
-
Studies of gene expression and activity of hexokinase, phosphofructokinase and glycogen synthase in human skeletal muscle in states of altered insulin-stimulated glucose metabolism.Dan Med Bull. 1999 Feb;46(1):13-34. Dan Med Bull. 1999. PMID: 10081651 Review.
-
Metabolism and insulin signaling in common metabolic disorders and inherited insulin resistance.Dan Med J. 2014 Jul;61(7):B4890. Dan Med J. 2014. PMID: 25123125 Review.
Cited by
-
Acupuncture Alters Expression of Insulin Signaling Related Molecules and Improves Insulin Resistance in OLETF Rats.Evid Based Complement Alternat Med. 2016;2016:9651592. doi: 10.1155/2016/9651592. Epub 2016 Sep 22. Evid Based Complement Alternat Med. 2016. PMID: 27738449 Free PMC article.
-
High-Intensity Interval Training Improves Markers of Oxidative Metabolism in Skeletal Muscle of Individuals With Obesity and Insulin Resistance.Front Physiol. 2018 Oct 31;9:1451. doi: 10.3389/fphys.2018.01451. eCollection 2018. Front Physiol. 2018. PMID: 30429793 Free PMC article.
-
IRS1 degradation and increased serine phosphorylation cannot predict the degree of metabolic insulin resistance induced by oxidative stress.Diabetologia. 2003 May;46(5):639-48. doi: 10.1007/s00125-003-1097-5. Epub 2003 May 15. Diabetologia. 2003. PMID: 12750770
-
Isoform-specific defects of insulin stimulation of Akt/protein kinase B (PKB) in skeletal muscle cells from type 2 diabetic patients.Diabetologia. 2008 Mar;51(3):512-21. doi: 10.1007/s00125-007-0913-8. Epub 2008 Jan 18. Diabetologia. 2008. PMID: 18204829
-
Opening of the mitochondrial permeability transition pore links mitochondrial dysfunction to insulin resistance in skeletal muscle.Mol Metab. 2013 Nov 26;3(2):124-34. doi: 10.1016/j.molmet.2013.11.003. eCollection 2014 Apr. Mol Metab. 2013. PMID: 24634818 Free PMC article.
References
-
- DeFronzo RA, Bonadonna RC, Ferrannini E. Pathogenesis of NIDDM. A balanced overview. Diabetes Care. 1992;15:318–368. - PubMed
-
- Kahn BB. Type 2 diabetes: when insulin secretion fails to compensate for insulin resistance. Cell. 1998;92:593–596. - PubMed
-
- Yki-Jarvinen H, Sahlin K, Ren JM, Koivisto VA. Localization of rate-limiting defect for glucose disposal in skeletal muscle of insulin-resistant type I diabetic patients. Diabetes. 1990;39:157–167. - PubMed
-
- Heesom KJ, Harbeck M, Kahn CR, Denton RM. Insulin action on metabolism. Diabetologia. 1997;40:B3–B9. - PubMed
-
- White MF. The insulin signalling system and the IRS proteins. Diabetologia. 1997;40:S2–S17. - PubMed
Publication types
MeSH terms
Substances
Grants and funding
LinkOut - more resources
Full Text Sources
Medical
Research Materials
Miscellaneous
