

Neuronal NT-3 is not required for synaptic transmission or long-term potentiation in area CA1 of the adult rat hippocampus
- PMID: 10492008
- PMCID: PMC311298
Neuronal NT-3 is not required for synaptic transmission or long-term potentiation in area CA1 of the adult rat hippocampus
Abstract
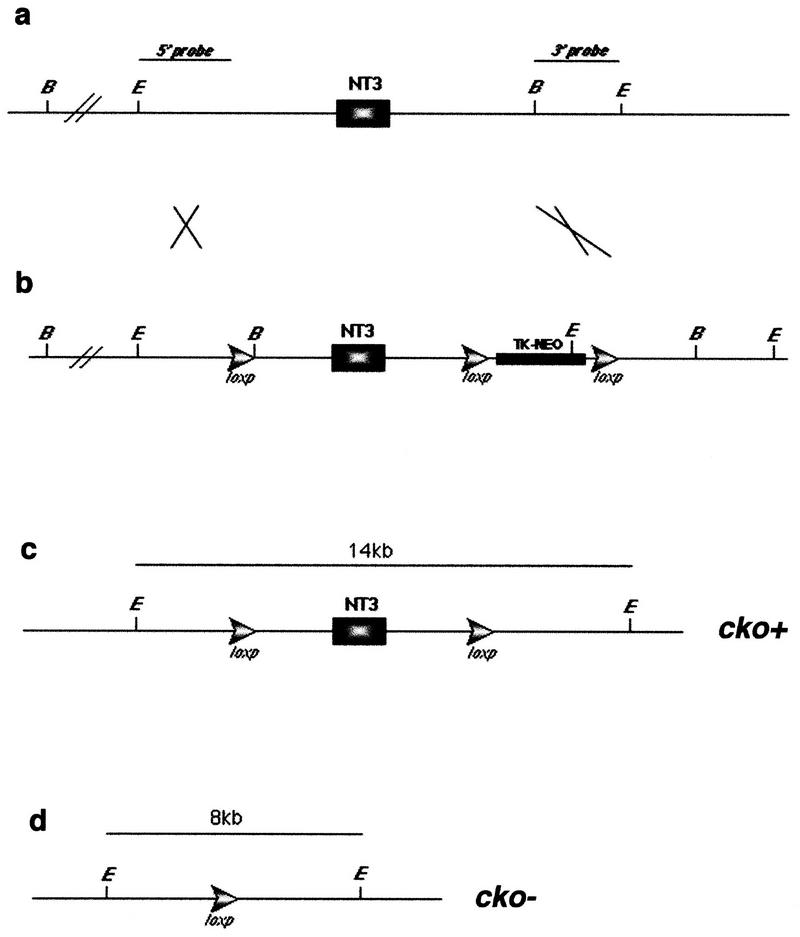
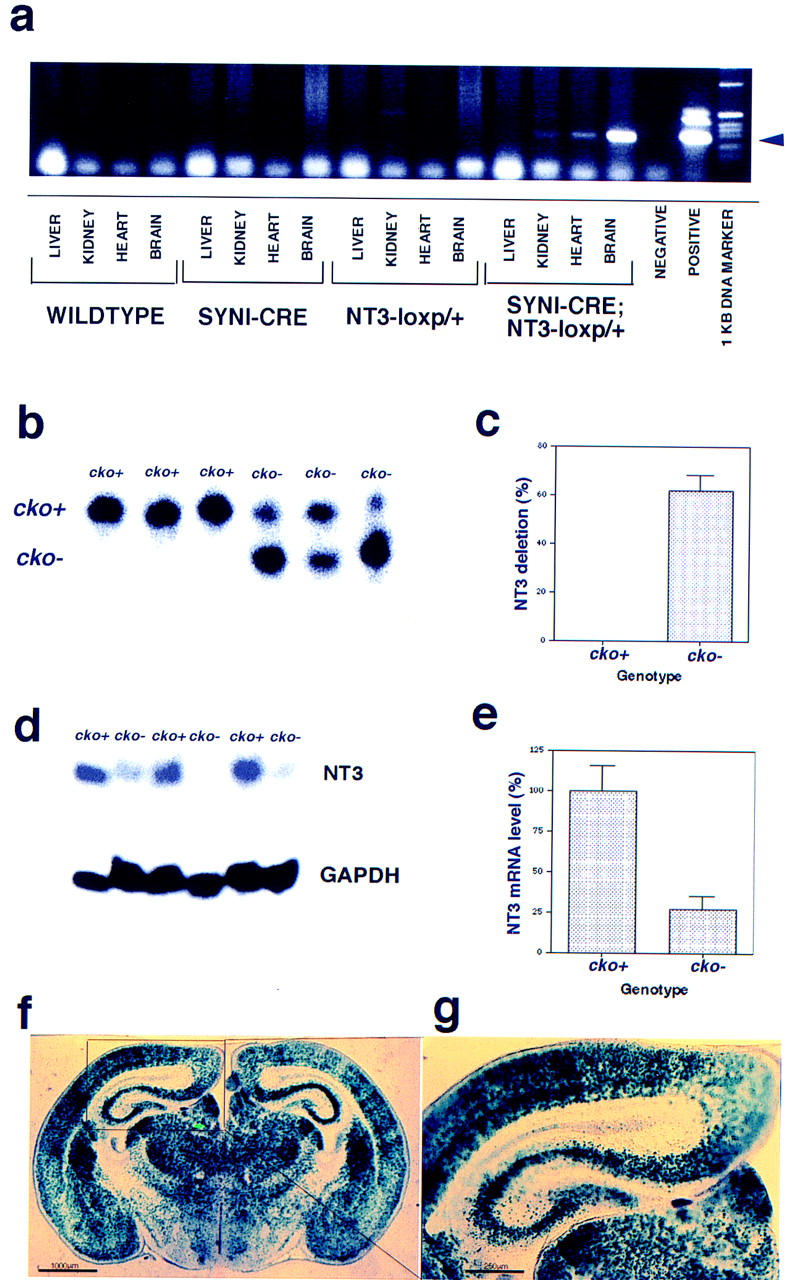
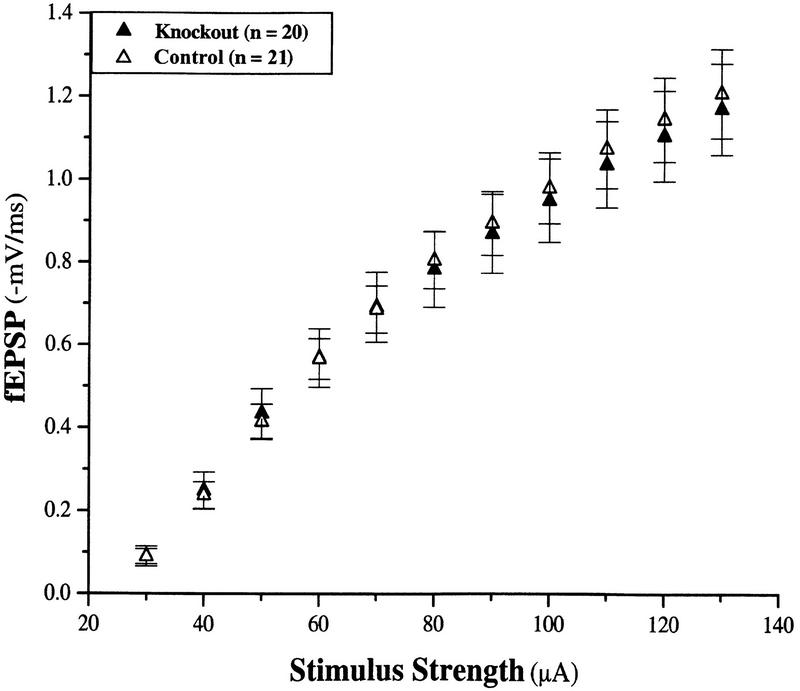
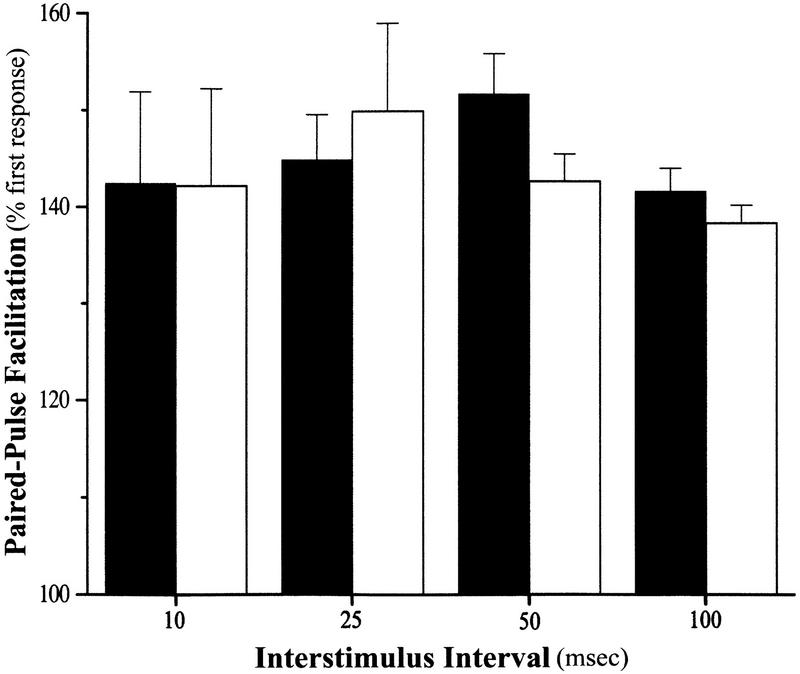
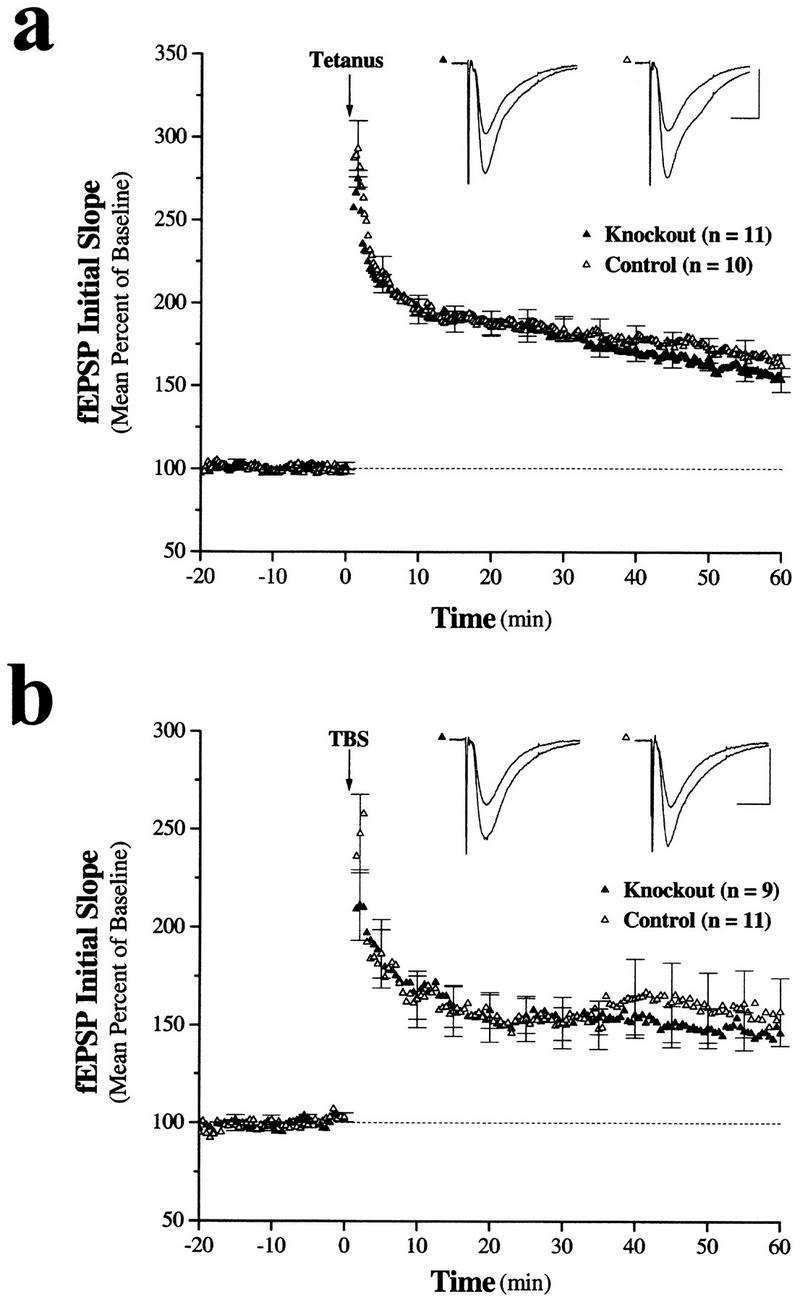
Neurotrophic factors, including BDNF and NT-3, have been implicated in the regulation of synaptic transmission and plasticity. Previous attempts to analyze synaptic transmission and plasticity in mice lacking the NT-3 gene have been hampered by the early death of the NT-3 homozygous knockout animals. We have bypassed this problem by examining synaptic transmission in mice in which the NT-3 gene is deleted in neurons later in development, by crossing animals expressing the CRE recombinase driven by the synapsin I promoter to animals in which the NT-3 gene is floxed. We conducted blind field potential recordings at the Schaffer collateral-CA1 synapse in hippocampal slices from homozygous knockout and wild-type mice. We examined the following indices of synaptic transmission: (1) input-output relationship; (2) paired-pulse facilitation; (3) post-tetanic potentiation; and (4) long-term potentiation: induced by two different protocols: (a) two trains of 100-Hz stimulation and (b) theta burst stimulation. We found no difference between the knockout and wild-type mice in any of the above measurements. These results suggest that neuronal NT-3 does not play an essential role in normal synaptic transmission and some forms of plasticity in the mouse hippocampus.
Figures
Similar articles
-
Neurotrophin-induced modulation of synaptic transmission in the adult hippocampus.J Physiol Paris. 1995;89(1):11-22. doi: 10.1016/0928-4257(96)80547-x. J Physiol Paris. 1995. PMID: 7581294
-
Differential alterations of synaptic plasticity in dentate gyrus and CA1 hippocampal area of Calbindin-D28K knockout mice.Brain Res. 2012 Apr 23;1450:1-10. doi: 10.1016/j.brainres.2012.02.036. Epub 2012 Feb 22. Brain Res. 2012. PMID: 22405690
-
Selective modulation of some forms of schaffer collateral-CA1 synaptic plasticity in mice with a disruption of the CPEB-1 gene.Learn Mem. 2004 May-Jun;11(3):318-27. doi: 10.1101/lm.72704. Learn Mem. 2004. PMID: 15169862 Free PMC article.
-
Synaptic plasticity in the hippocampal area CA1-subiculum projection: implications for theories of memory.Hippocampus. 2000;10(4):447-56. doi: 10.1002/1098-1063(2000)10:4<447::AID-HIPO11>3.0.CO;2-2. Hippocampus. 2000. PMID: 10985284 Review.
-
Neurotrophin regulation of synaptic transmission.Curr Opin Neurobiol. 1999 Feb;9(1):105-9. doi: 10.1016/s0959-4388(99)80013-0. Curr Opin Neurobiol. 1999. PMID: 10072368 Review.
Cited by
-
Differential requirements for semaphorin 3F and Slit-1 in axonal targeting, fasciculation, and segregation of olfactory sensory neuron projections.J Neurosci. 2004 Oct 13;24(41):9087-96. doi: 10.1523/JNEUROSCI.2786-04.2004. J Neurosci. 2004. PMID: 15483127 Free PMC article.
-
Recording long-term potentiation of synaptic transmission by three-dimensional multi-electrode arrays.BMC Neurosci. 2006 Aug 30;7:61. doi: 10.1186/1471-2202-7-61. BMC Neurosci. 2006. PMID: 16942609 Free PMC article.
-
Intracellular Ca(2+) and Ca(2+)/calmodulin-dependent kinase II mediate acute potentiation of neurotransmitter release by neurotrophin-3.J Cell Biol. 2000 May 15;149(4):783-92. doi: 10.1083/jcb.149.4.783. J Cell Biol. 2000. PMID: 10811820 Free PMC article.
-
Novel SH-SAW Biosensors for Ultra-Fast Recognition of Growth Factors.Biosensors (Basel). 2021 Dec 30;12(1):17. doi: 10.3390/bios12010017. Biosensors (Basel). 2021. PMID: 35049645 Free PMC article.
-
Coordinate action of pre- and postsynaptic brain-derived neurotrophic factor is required for AMPAR trafficking and acquisition of in vitro classical conditioning.Neuroscience. 2008 Aug 26;155(3):686-97. doi: 10.1016/j.neuroscience.2008.06.043. Epub 2008 Jun 25. Neuroscience. 2008. PMID: 18639615 Free PMC article.
References
-
- Bates B, Rios M, Trumpp A, Chen C, Fan G, Bishop JM, Jaenisch R. Neurotrophin-3 is required for proper cerebellar development. Nat Neurosci. 1999;2:115–117. - PubMed
-
- Castren E, Pitkanen M, Sirvio J, Parsadanian A, Lindholm D, Thoenen H, Riekkinen P. The induction of LTP increases BDNF and NGF mRNA but decreases NT-3 mRNA in the dentate gyrus. Neuroreport. 1993;4:895–898. - PubMed
-
- Elmer E, Kokaia M, Ernfors P, Ferencz I, Kokaia Z, Lindvall O. Suppressed kindling epileptogenesis and perturbed BDNF and TrkB gene regulation in NT-3 mutant mice Exp. Neurol. 1997;145:93–103. - PubMed
-
- Ernfors P, Wetmore C, Persson H. Identification of cells in rat brain and peripheral tissues expressing mRNA for members of the nerve growth factor family. Neuron. 1990;5:511–526. - PubMed
Publication types
MeSH terms
Substances
Grants and funding
LinkOut - more resources
Full Text Sources
Molecular Biology Databases
Research Materials
Miscellaneous