. 1999 Oct 1;19(19):8182-98.
doi: 10.1523/JNEUROSCI.19-19-08182.1999.

Cellular and molecular mechanisms of glial scarring and progressive cavitation: in vivo and in vitro analysis of inflammation-induced secondary injury after CNS trauma

Affiliations

Cellular and molecular mechanisms of glial scarring and progressive cavitation: in vivo and in vitro analysis of inflammation-induced secondary injury after CNS trauma

M T Fitch et al. J Neurosci. .

Abstract

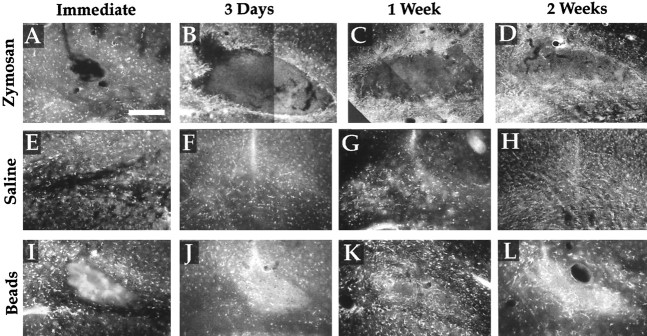
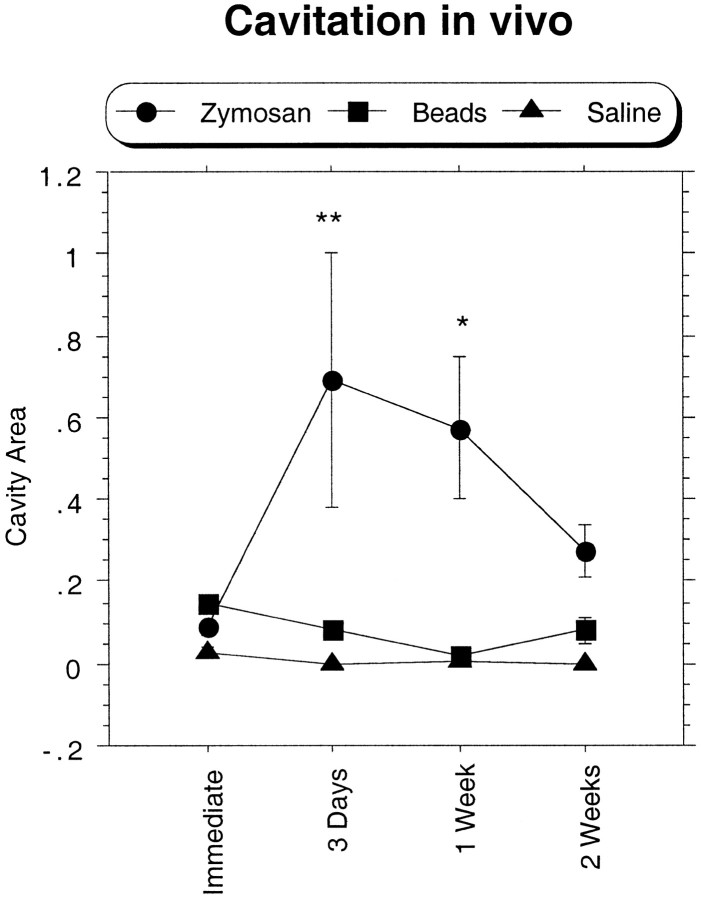
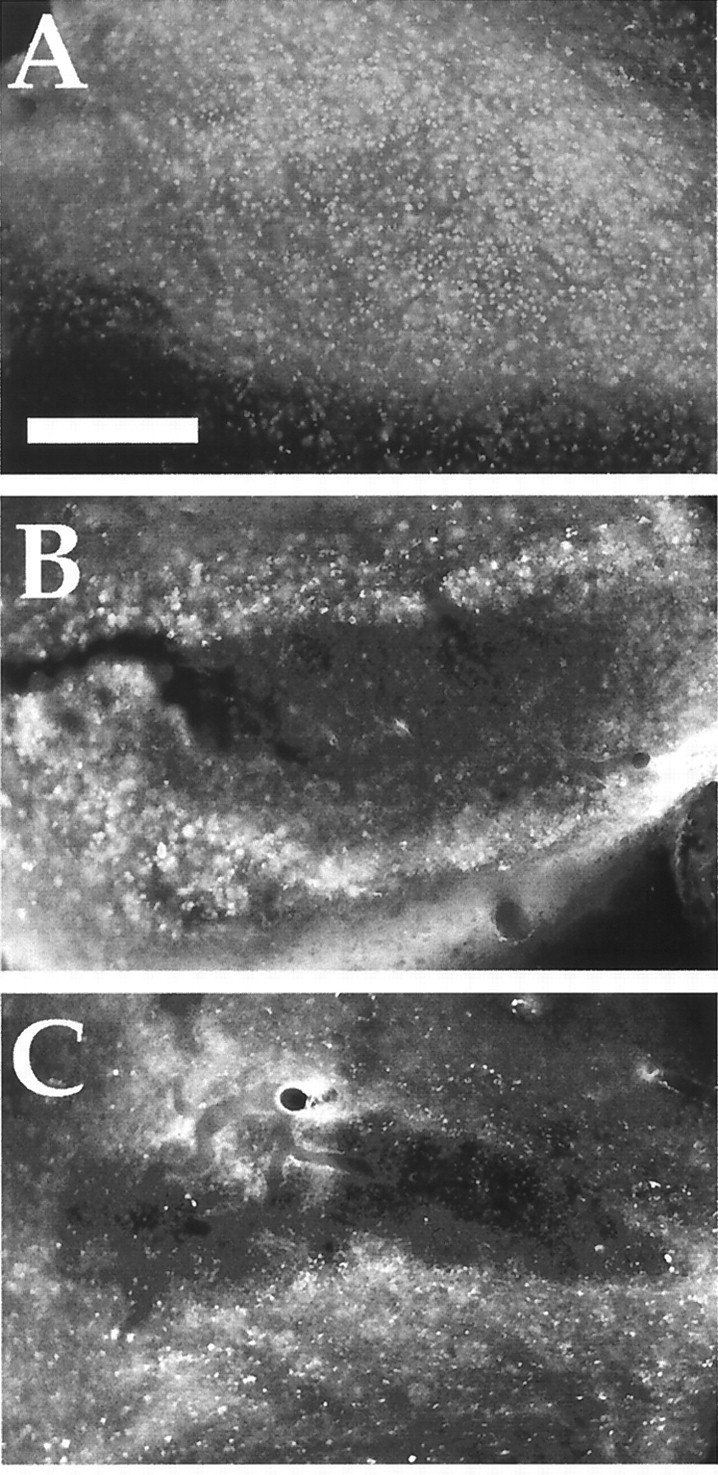
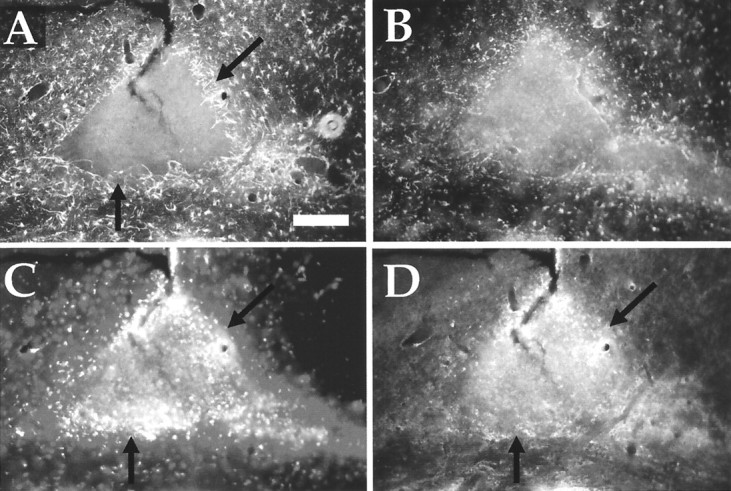
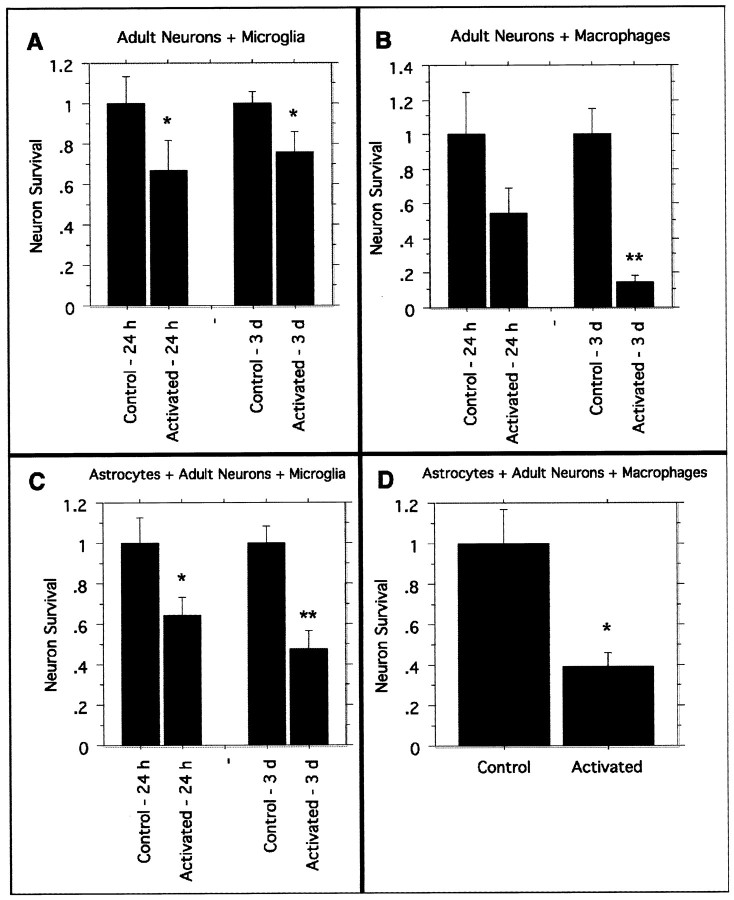
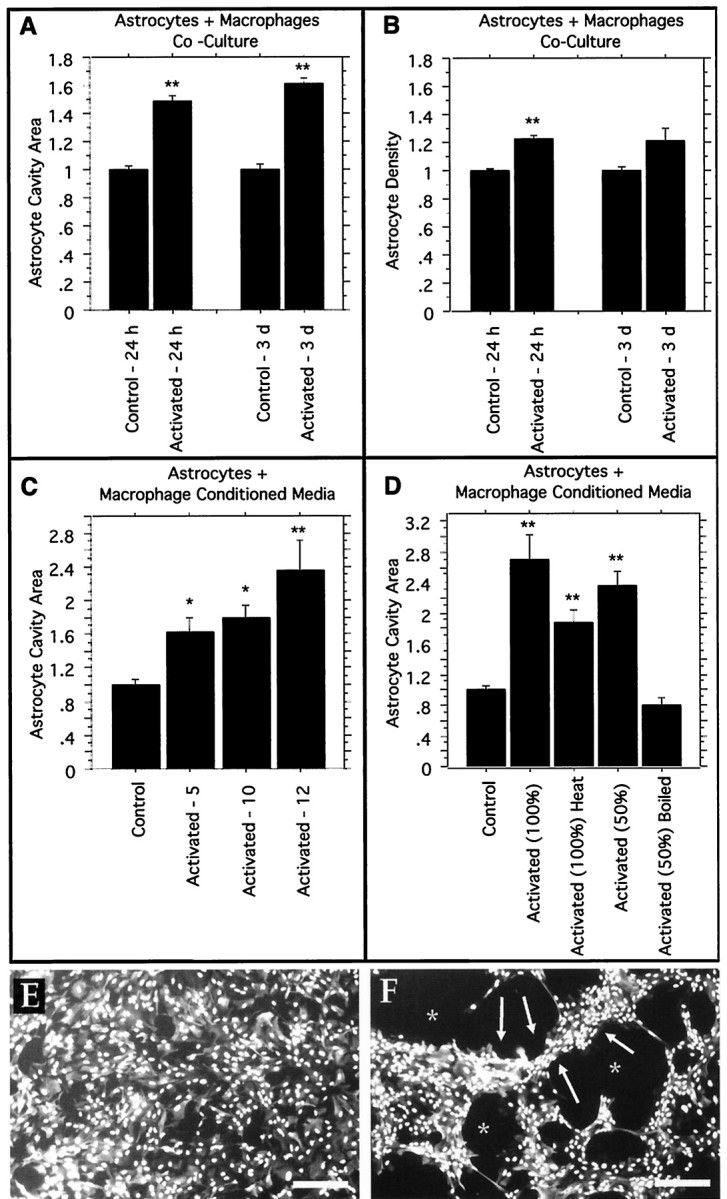
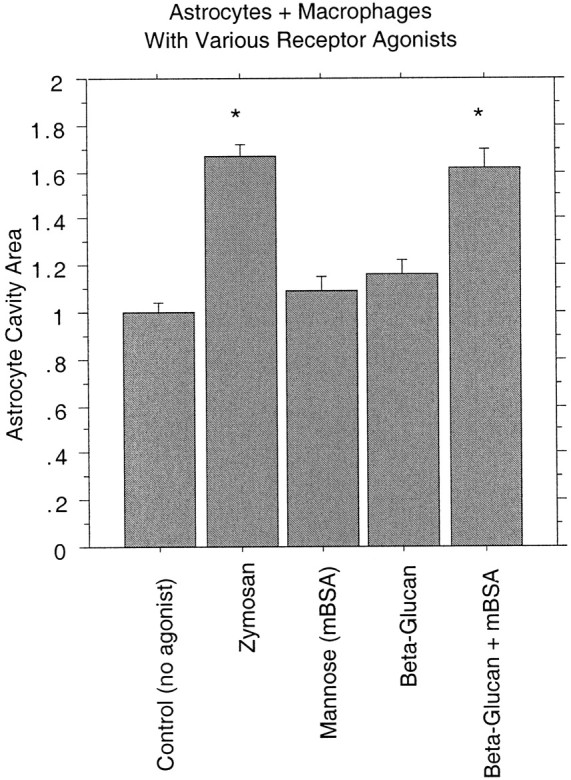
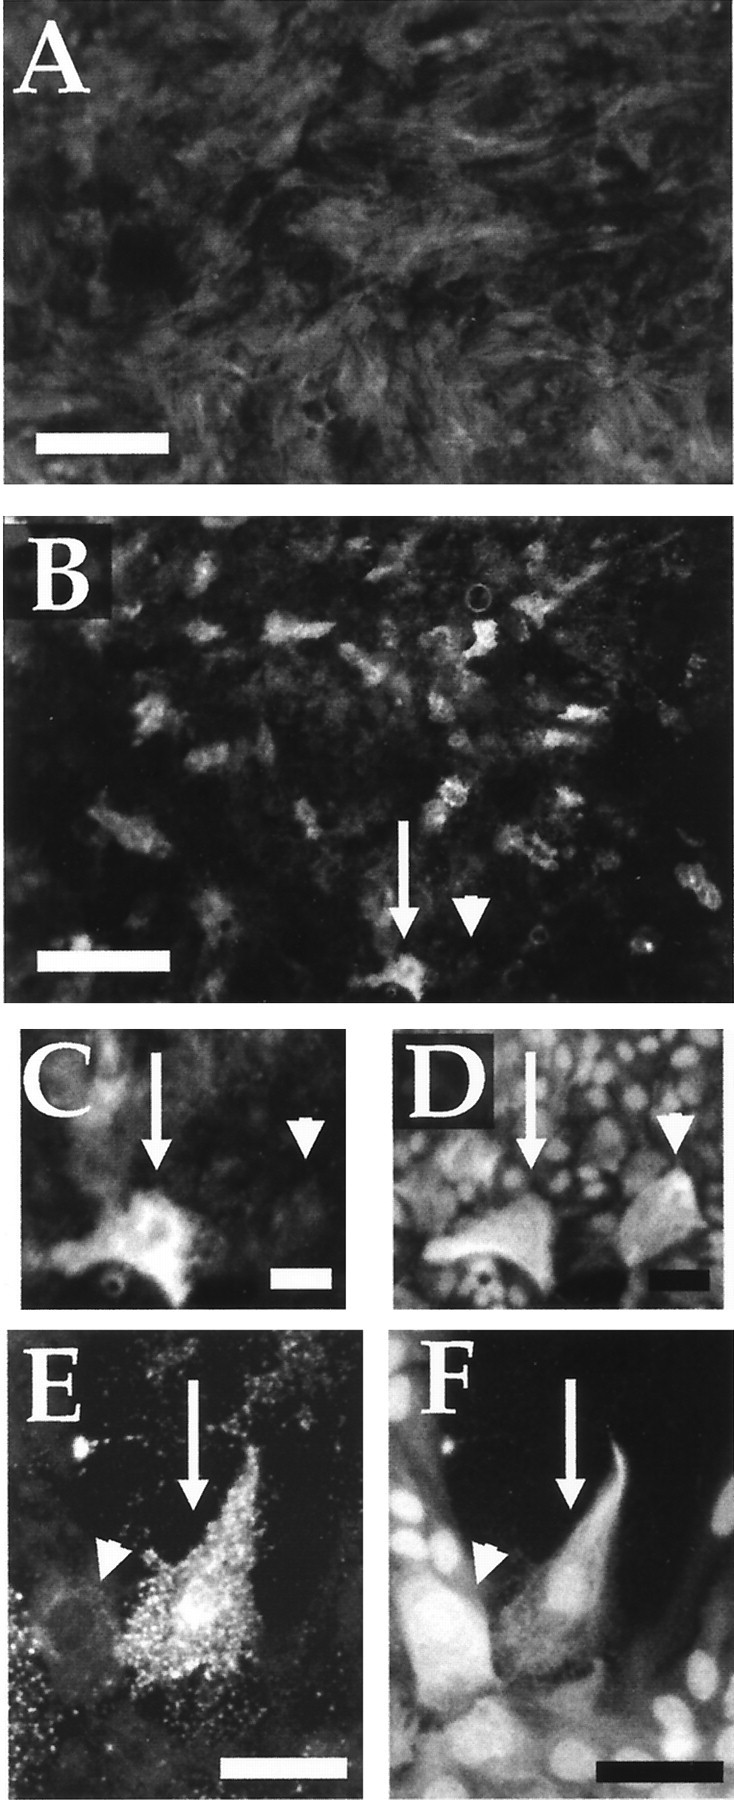
Post-traumatic cystic cavitation, in which the size and severity of a CNS injury progress from a small area of direct trauma to a greatly enlarged secondary injury surrounded by glial scar tissue, is a poorly understood complication of damage to the brain and spinal cord. Using minimally invasive techniques to avoid primary physical injury, this study demonstrates in vivo that inflammatory processes alone initiate a cascade of secondary tissue damage, progressive cavitation, and glial scarring in the CNS. An in vitro model allowed us to test the hypothesis that specific molecules that stimulate macrophage inflammatory activation are an important step in initiating secondary neuropathology. Time-lapse video analyses of inflammation-induced cavitation in our in vitro model revealed that this process occurs primarily via a previously undescribed cellular mechanism involving dramatic astrocyte morphological changes and rapid migration. The physical process of cavitation leads to astrocyte abandonment of neuronal processes, neurite stretching, and secondary injury. The macrophage mannose receptor and the complement receptor type 3 beta2-integrin are implicated in the cascade that induces cavity and scar formation. We also demonstrate that anti-inflammatory agents modulating transcription via the nuclear hormone receptor peroxisome proliferator-activated receptor-gamma may be therapeutic in preventing progressive cavitation by limiting inflammation and subsequent secondary damage after CNS injury.


Figures

Fig. 1.
Fig. 1.
Astrocyte GFAP staining of statistically representative tissue sections (selected based on average cavity sizes; see Fig. 2) at the site of minimally invasive microinjections of zymosan (A–D; n = 32), saline (E–H; n = 14), or latex beads (I–L; n = 10) immediately (A, E, I), 3 d (B, F, J), 1 week (C, G, K), and 2 weeks (D, H, L) after injection. Note the enlarged astrocyte-free cavity present at 3 d (B) and 1 week (C) after microinjection of zymosan, a potent inflammatory stimulant. There is no significant increase in cavity size after saline injection (E–H), and no significant increase in cavity size is seen after injection of particulate latex beads (I–K) the same size and concentration as zymosan particles. Scale bar, 340 μm.
Fig. 2.
Fig. 2.
Graphical comparisons and statistical analysis of the average size (± SEM) of the astrocyte-free cavity areas (in mm2) after in vivo callosal microinjections of zymosan (n = 32), saline (n = 14), or latex beads (n = 10). Cavity sizes are significantly larger than that of the immediate time point after zymosan injection at 3 d (p < 0.01) and 1 week (p < 0.05), and by 2 weeks the healing process has diminished the cavity to within control levels as astrocytes have repopulated the cavity. Injections of saline or latex beads do not lead to significant increases in cavity size at any time point. ANOVA with Fisher’s PLSD is reported relative to the immediate time point for each category (*p < 0.05; **p < 0.01).
Fig. 3.
Fig. 3.
The area of axon damage precisely surrounds the area of astrocyte cavitation at 3 d after zymosan injectionin vivo but does not show evidence of repair or regeneration of neurofilament-containing axons after astrocytes repopulate the cavity after 2 weeks. A, Astrocyte GFAP staining demarcates this white matter cavity at 3 d (same section shown in Fig. 1B). B–D,Neurofilament staining in B demonstrates an increased intensity in the axons at the borders of the developing cavity in an adjacent section to A, and ends of axons that have been secondarily damaged can be seen at high power in C from the areaoutlined in B. Dystrophic axon endings are found within the cavity (C;arrows) and are also demonstrated in another 3 d developing cavity (D;arrows). E, F, Astrocyte GFAP staining in E illustrates the partial filling in of the cavity by astrocytes at 2 weeks after injection, which is not mirrored by any changes in the neurofilament-containing axons as seen in F.G, These destructive effects on axons were not seen at the injection site with neurofilament staining immediately after zymosan injection (arrow), illustrating the minimal direct injury from the injection itself. Scale bars: A, B, 200 μm; C, D, 20 μm; E–G,180 μm.
Fig. 4.
Fig. 4.
Fluorescent photomicrographs of zymosan-induced inflammation in vivo within the developing cavities 3 d (A), 1 week (B), and 2 weeks (C) after zymosan injection. The high concentration of activated macrophages and microglia stained with ED1 present at 3 d (A) gradually diminishes from 1 week (B) to 2 weeks (C). Scale bar, 340 μm.
Fig. 5.
Fig. 5.
Representative zymosan-induced cavities, inflammation, and proteoglycan upregulation at 3 d after microinjection in vivo. Astrocyte GFAP staining (A) and vimentin intermediate filament staining (B) demarcate the astrocyte-free cavity that is filled with activated macrophages and microglia (C). These inflammatory infiltrates are associated with increases in proteoglycans (D), especially at the borders of the developing cavity (arrows; A, C,D). Scale bar, 225 μm.
Fig. 6.
Fig. 6.
Analysis of zymosan microinjection sites in vivo at 1 week (A, B) and 2 weeks (C, D) using double-immunostaining techniques to visualize GFAP (A, C) and chondroitin sulfate proteoglycans (B, D). Note the increases in proteoglycans associated with the borders of the cavity (A, B; whitearrowheads) and the intense upregulation of proteoglycan staining associated with blood vessels within the cavity at 1 week (B;blackarrows) and 2 weeks (D; blackarrows; higher power). Intensely GFAP+ astrocytes have repopulated and filled in the cavity at 2 weeks in C (higher power), which reduces the cavity size to control levels found immediately after injection (see Fig. 2). Scale bars, 250 μm.
Fig. 7.
Fig. 7.
Activated microglial cells and activated peritoneal macrophages are detrimental to adult neurons in direct coculture conditions. A, The survival of adult DRG neurons is diminished by the presence of zymosan-activated microglial cells at 24 hr and 3 d in comparison with control nonactivated microglial cells (controls standardized to 1.0 in allgraphs). B, Similarly, adult DRG neuron survival is compromised by the addition of activated peritoneal macrophages as compared with nonactivated macrophages.C, Growth of adult neurons on supportive astrocyte monolayers is not sufficient to prevent the loss of live neurons caused by activated microglial cells at 24 hr and 3 d of culture.D, Similarly, activated peritoneal macrophages added to adult neurons cultured on astrocyte monolayers lead to a significant loss of live neurons when compared with nonactivated macrophages at 24 hr of culture. Significance is relative to the control nonactivated macrophage preparations using the nonparametric Mann–WhitneyU test, and graphs report group means ± SEM (*p < 0.05; **p < 0.0001).
Fig. 8.
Fig. 8.
Inflammation leads to astrocyte cavitation in the in vitro astrocyte cystic cavitation model. The area of astrocyte cavity per microscopic field is significantly increased by activated macrophages or activated macrophage– conditioned media. A, B, Astrocytes + macrophages coculture. Astrocyte monolayers were established on poly-l-lysine coverslips, and peritoneal macrophages were added with no activating stimulant [control nonactivated macrophages (Control)] or with zymosan particles [activated macrophages (Activated)]. Control cultures are normalized to a value of 1, and all replicates are combined and expressed relative to their own individual controls. A,Astrocyte cavity area per field of view (areas of the culture that were covered previously by the confluent monolayer of astrocytes and that are subsequently devoid of cells). Significant increases at 24 hr (p < 0.0001) and 3 d (p < 0.0001) in the presence of activated macrophages as compared with nonactivated macrophages are shown.B, The density of astrocytes. A significant increase at 24 hr (p < 0.0001) and a slight increase at 3 d (p = 0.0723) suggest that astrocyte migration may be occurring in the cultures exposed to activated macrophages. C, D, Astrocytes + macrophage-conditioned media. Astrocyte monolayers were established with conditioned media from macrophage cultures, either zymosan-activated macrophages (Activated) or nonactivated control macrophages (Control). Control cultures are normalized to a value of 1. C, Cavity area of astrocyte monolayers grown on laminin in the presence of macrophage-conditioned media for 3 d with increasing numbers of macrophages present during the initial conditioning step (5 × 10⁶, 10 × 106, and 12 × 106macrophages per 10 ml of conditioned media). The significant cavity formation produced by activated macrophage–conditioned media is demonstrated. D, Cavity area of astrocyte monolayers grown on poly-l-lysine in the presence of macrophage-conditioned media for 24 hr with various treatments to the conditioned media. Full-strength conditioned media [Activated (100%)] lead to a significantly larger culture cavity (p < 0.0001), whereas heating that same full-strength media to 60°C for 15 min [Activated (100%) Heat] modestly decreases the cavitation, which is still significantly higher than that in control nonactivated macrophage–conditioned media that have been heated (p < 0.0001). Conditioned media diluted to 50% strength with fresh media [Activated (50%)] retain cavity-inducing activity (p < 0.0001), but boiling the conditioned media for 40 min before 50% dilution with fresh media [Activated (50%) Boiled] abolishes the effects. E, F, Representa-tive photomicrographs of as-trocyte cultures in the in vitrocavitation model stained with GFAP to visualize astrocyte intermediate filaments and with DAPI to visualize cell nuclei demonstrating a typical control (E; nonactivated macrophage–conditioned media from C) and a typical activated (F; activated macrophage–conditioned media from C). Note the even distribution of the astrocyte monolayer in E, whereas F contains areas of increased astrocyte density (arrows) and areas of culture cavity (asterisks). Similar results were seen with the cell coculture experiments reported in A andB. Scale bars, 225 μm. ANOVA with reported significance is relative to the appropriate control nonactivated macrophage preparation or conditioned media, and graphsreport group means ± SEM (*p < 0.005; **p < 0.0001).
Fig. 9.
Fig. 9.
Simultaneous activation of both the macrophage mannose receptor and the β-glucan–binding site of CR3 on macrophages induces astrocyte cavitation in the in vitro astrocyte cystic cavitation model. Each receptor agonist category is expressed relative to simultaneous control (no agonist) nonactivated macrophage and astrocyte cocultures set to a value of 1, and all replicates are combined for each category. Astrocyte monolayers were established, and peritoneal macrophages were added with no activating stimulant [Control(no agonist); nonactivated macrophages] or with various receptor agonists (zymosan, mBSA, β-glucan, or β-glucan + mBSA). Mannose receptor agonists alone (mBSA) or CR3 β-glucan site agonists alone (purified particulate β-glucan) were not sufficient to activate the macrophages to induce the formation of astrocyte cavities in vitro. However, addition of both mBSA and β-glucan simultaneously as macrophage activators in the macrophage and astrocyte coculture mimicked the development of astrocyte cavities induced by the zymosan stimulation of macrophages. ANOVA with reported significance is relative to the control (no agonist) nonactivated macrophage preparation or conditioned media, and the graph reports group means ± SEM (*p < 0.0001).
Fig. 10.
Fig. 10.
Time-lapse video analysis of the in vitro cavitation model. A, Selectedpanels from time-lapse video analysis of a developing astrocyte cavity in an astrocyte and zymosan-activated macrophage coculture. Intervals of 45 min separate each panel(1–6) for a total recording time of 3.75 hr. Note the double-headedarrows in panels1 and6 that demarcate the width of the cavity at this location for each time point, illustrating the increase in cavity size at that point from ∼80 to 200 μm over the observed time period.Arrows track a single astrocyte as it is stretched until it is broken or dislodged (panel 2), gradually moves up from the surface of the culture plate (panels 3, 4), and migrates back on top of the astrocyte monolayer (panel 5) where it remains as a loosely attached ball (panel 6). Presumably, loosely attached cells such as this one would be subsequently lost into the liquid phase of the culture media either before or after culture fixation. B, Time-lapse video analysis of a rapidly appearing astrocyte cavity that exposes, stretches, and exerts force on overlying neurites that were abandoned by the supportive astrocyte substrate in an astrocyte, adult DRG neuron, and zymosan-activated macrophage coculture. Elapsed time is indicated in the lowerright-handcorner of eachpanel. Note the astrocyte at 0 and 4 min that is undergoing mitosis (largearrow; 0 min) with the clearly visible separating chromosomes (smalldoublearrows; 4 min). This single cell apparently occupies a key location for holding the local astrocyte meshwork together, as demonstrated at 5 min when this single cell has completed dividing and the astrocyte networks on either side rapidly pull apart leaving a cavity that continues to grow from 5 to 30 min. Neurites from the adult DRG neurons are growing throughout this area of the culture and are exposed across this cavity by the astrocyte withdrawal and subsequent cavity formation. Note the dynamic movements of the neurites after the astrocyte abandonment as they are pulled and stretched by the astrocytes on either side of this developing cavity. Scale bars: A, 100 μm; B, 40 μm.
Fig. 11.
Fig. 11.
Selected panels from time-lapse video analysis demonstrating that astrocyte movements can have dynamic effects on neuron processes during astrocyte abandonment and cavity formation. An interval of 6 min separates each panel for a total recording time of 54 min. Panel 1 is a low-power view of an adult DRG neuron (arrow) with a process (boxedarea) that can be followed at higher power in panels 2–10. Note especially the astrocyte marked with an arrowhead and the bifurcated neurite marked with an arrow in panels 2and 3. As this astrocyte cavity gradually increases in size, the marked astrocyte is pulled and stretched to a very thin morphology, whereas the marked neurite is broken or pulled free from its original connection in panel 3 and is left to retract in panels 4–10. Note the retracting end of the neurite that is being reabsorbed in panels 9 and10 (arrows). This is a dramatic demonstration of the potential for neurite damage seen several times in our time-lapse analysis simply because of the physical processes of astrocyte movement and withdrawal. Scale bar, 40 μm.
Fig. 12.
Fig. 12.
Inflammation in vitro leads to heterogeneous increases in proteoglycans in astrocyte cultures. Areas of the in vitro cavitation model were stained for chondroitin sulfate proteoglycans (A–C, E) or GFAP (D, F). A, Astrocytes with nonactivated macrophages demonstrate a uniform low level of proteoglycan staining in control cultures, a result that is also seen in astrocyte cultures with zymosan only or with nonactivated macrophage–conditioned media (data not shown). B–D, In contrast, individual cells with increased levels of proteoglycans can be observed in astrocyte cultures containing activated macrophages (data not shown) or in astrocyte-only cultures with activated macrophage–conditioned media (B). Thearrow and arrowhead in Bindicate two astrocytes shown in high power in C(proteoglycan) and D (GFAP). One astrocyte has increased proteoglycan staining (arrow), whereas the other nearby astrocyte has no such increase (arrowhead). E, F, High-power view is shown of two astrocytes (arrow and arrowhead) in which one has increased proteoglycan staining (E) whereas the other does not in an astrocyte culture (GFAP inF) with activated macrophages. Scale bars:A, B, 210 μm; C, D, 40 μm; E, F, 60 μm.
Fig. 13.
Fig. 13.
Quantitative analysis of the changes in astrocyte and macrophage cocultures by activation of macrophages and treatment with anti-inflammatory PPAR-γ agonists. Each treatment category is expressed relative to the appropriate drug- or vehicle-treated nonactivated macrophage control, with the average for each control group being set to 1 and all replicates being combined in each category. The area of astrocyte cavity per microscopic field is significantly increased by activated macrophages with no treatment (vehicle), which is analogous to the cavitation found after anin vivo CNS injury. Indomethacin treatment (100 μm) of the zymosan-activated macrophages does not prevent this increase in the area of the culture cavity relative to control levels. Prostaglandin J2 treatment (10 μm) and ciglitazone treatment (50 μm) of the zymosan-activated macrophages while interacting with the astrocyte cultures abolish the increases in the area of culture cavities relative to their control levels with nonactivated macrophages. ANOVA with Fisher’s PLSD statistical significance is relative to the pooledControl: Nonactivatedmacrophages category (*p < 0.0005; **p < 0.0001).

References

    1. Alvarez-Buylla A, Temple S. Stem cells in the developing and adult nervous system. J Neurobiol. 1998;36:105–110. - PubMed
    1. Andersson PB, Perry VH, Gordon S. The acute inflammatory response to lipopolysaccharide in CNS parenchyma differs from that in other body tissues. Neuroscience. 1992;48:169–186. - PubMed
    1. Anthony DC, Bolton SJ, Fearn S, Perry VH. Age-related effects of interleukin-1 beta on polymorphonuclear neutrophil-dependent increases in blood-brain barrier permeability in rats. Brain. 1997;120:435–444. - PubMed
    1. Balentine JD. Pathology of experimental spinal cord trauma. I. The necrotic lesion as a function of vascular injury. Lab Invest. 1978;39:236–253. - PubMed
    1. Bartholdi D, Rubin BP, Schwab ME. VEGF mRNA induction correlates with changes in the vascular architecture upon spinal cord damage in the rat. Eur J Neurosci. 1997;9:2549–2560. - PubMed

Publication types

MeSH terms

LinkOut - more resources