. 1999 Oct 1;19(19):8199-206.
doi: 10.1523/JNEUROSCI.19-19-08199.1999.

Ceramide signaling downstream of the p75 neurotrophin receptor mediates the effects of nerve growth factor on outgrowth of cultured hippocampal neurons

Affiliations

Ceramide signaling downstream of the p75 neurotrophin receptor mediates the effects of nerve growth factor on outgrowth of cultured hippocampal neurons

A B Brann et al. J Neurosci. .

Abstract

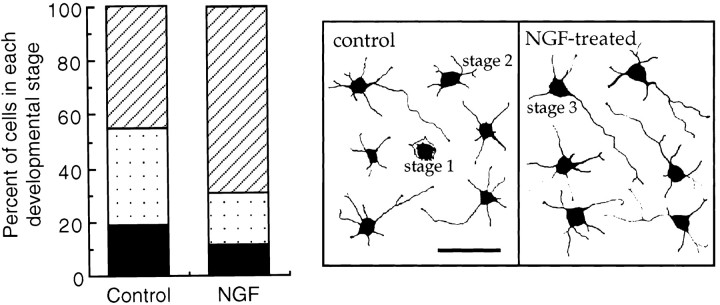
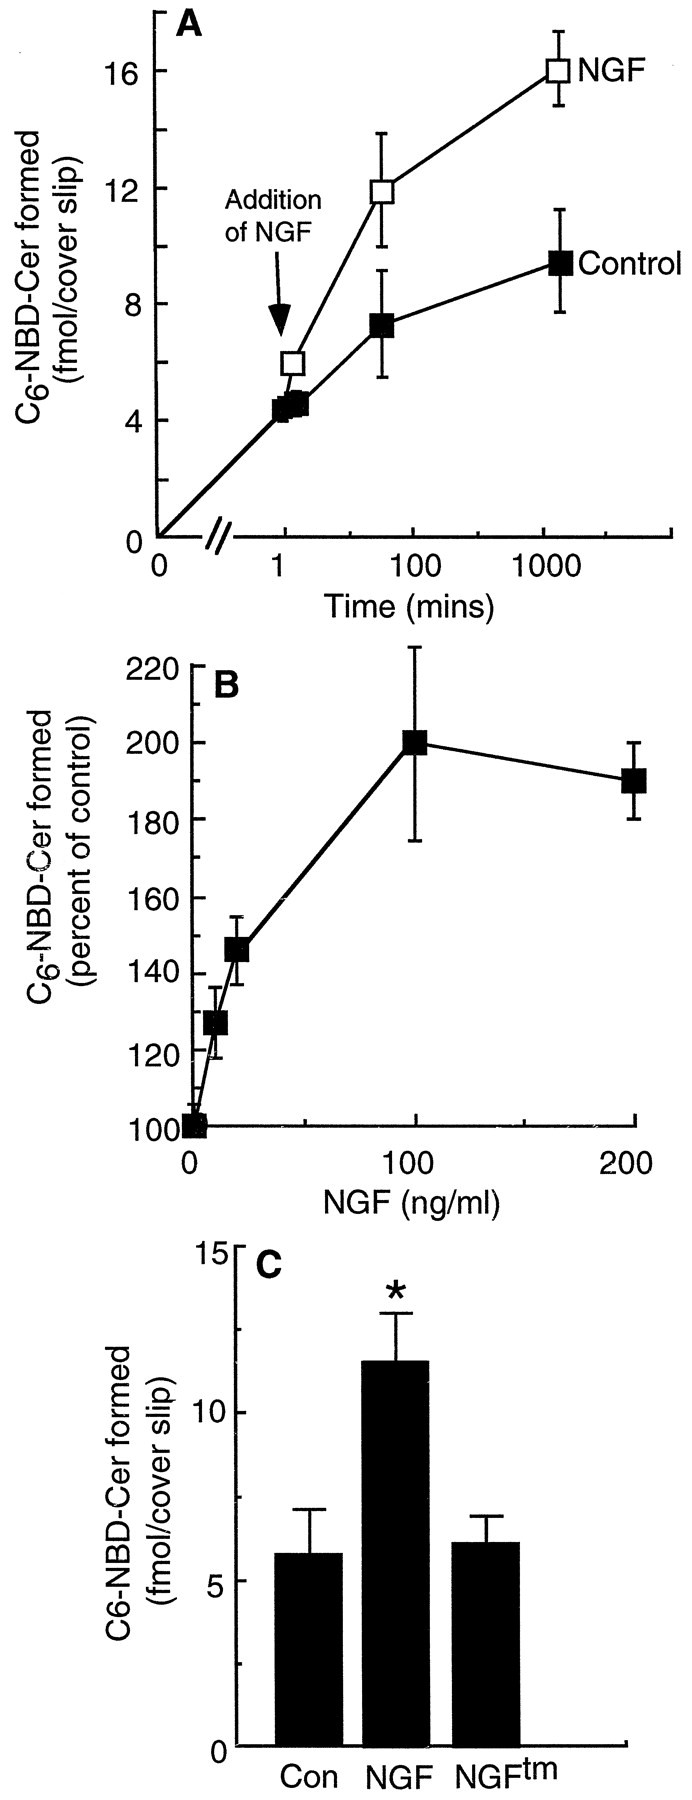
The p75 neurotrophin receptor (p75NTR) binds all known neurotrophins and has been suggested to either function as a coreceptor for the trk receptor tyrosine kinases or be involved in independent signaling leading to cell death. We have analyzed the effects of nerve growth factor (NGF) on the growth of cultured hippocampal pyramidal neurons and examined the possibility that the effects of NGF are mediated via generation of ceramide produced by neutral sphingomyelinase (N-SMase). During the initial hour of culture, the only detectable NGF receptor is p75NTR, which by comparative Western blot is expressed at 50- to 100-fold lower levels than on PC12 cells. At this early stage of culture, NGF accelerates neurite formation and outgrowth and induces ceramide formation in a dose-dependent manner. An NGF mutant that is deficient in p75NTR binding has no effect on neuronal morphology or ceramide formation. Furthermore, two anti-p75NTR antibodies (REX and 9651), which are known to compete with NGF for binding to p75NTR, mimic the effects of NGF, whereas a monoclonal antibody (MC192) targeted against a different epitope does not. Finally, scyphostatin, a specific N-SMase inhibitor, blocks the effects of NGF. We propose that a neurotrophin-p75NTR-ceramide signaling pathway influences outgrowth of hippocampal neurons. This signaling role of p75NTR may be distinct from other signaling pathways that lead to apoptosis.


Figures

Fig. 1.
Fig. 1.
Characterization of SMase activities in hippocampal neurons. A, Cation dependence. Homogenates of hippocampal neurons (preplated) (20 μg of protein) were assayed in 25 mm KCl, and 50 mm Tris, pH 7.4, for N-SMase activity or in MES buffer, pH 4.7, for A-SMase activity, by incubation with C6-NBD-SM (10 μm) in a final volume of 200 μl, with or without addition of cations or EDTA. After 1 hr at 37°C, the reaction was terminated, and C6-NBD-Cer formation was analyzed. Results are means ± SEM of three independent experiments. B, Specific activity. Homogenates of hippocampal neurons (20 μg of protein) were assayed in 25 mm KCl, 10 mm MgCl2, and 50 mm Tris, pH 7.4, for N-SMase activity or in MES buffer, pH 4.7, for A-SMase activity, by incubation with C6-NBD-SM in a final volume of 50 μl. After 1 hr at 37°C, the reaction was terminated, and C6-NBD-Cer formation was analyzed. Results are means ± SEM of two independent experiments.
Fig. 2.
Fig. 2.
Neurotrophin receptor expression in hippocampal neurons. A, Total RNA was extracted from neurons before plating (preplating) and analyzed by RPA. Assays were repeated on three different RNA extractions, producing the same results. The position of a 400 nt marker is shown. H, hippocampal neurons; Y, yeast tRNA. B, Poly(A+) mRNA was extracted from neurons before plating (−3), 1 hr after coculturing with the glia (1), and 24 hr after coculturing (24). Comparison samples include mRNA from glia (G) and from PC12 cells (PC12). RT-PCR was repeated three times producing the same results. C, Western blot analysis was performed on total cellular protein of hippocampal neurons after 1 hr in culture. PC12 cell extracts were run for comparison. Each lanerepresents ∼300,000 cells. Right, Probed with anti-REX IgG; left, probed with 9651 antiserum. Note that the PC12 lane probed with anti-REX is overexposed to enable detection in the neuronal sample.
Fig. 3.
Fig. 3.
Effect of NGF on neuronal development. NGF (200 ng/ml) was added to cultures immediately after the coverslips containing the neurons were placed in multiwell dishes containing a glial monolayer. Neuronal morphology was analyzed after 18 hr. Theleft panel shows the percent of cells in each developmental stage as means for three different cultures in which 50 cells per coverslip were analyzed for four coverslips per treatment: stage 1 (filled bars), stage 2 (spotted bars), and stage 3 (striped bars). The distribution of control cells is statistically different from that of NGF-treated cells (p = 0.0001; χ2 test). The right panel shows camera lucida drawings obtained from distinct fields of typical control and NGF-treated cells and gives examples of each developmental stage.
Fig. 4.
Fig. 4.
Effect of NGFtm and anti-p75NTR on neuronal growth. A, Hippocampal neurons were incubated with NGF or NGFtm immediately after placing coverslips in multiwell dishes with or without a glial monolayer, and development was compared with control cells (Con); NGF and NGFtm were added at a concentration of 200 ng/ml in the presence of glia and 50 ng/ml in the absence of glia. Data are means ± SEM of the percent of stage 3 cells after 18 hr in culture for three different cultures in which 50 cells per coverslip were analyzed for four coverslips per treatment. *p < 0.01, statistically significant differences from control; ANOVA. B, Neurons were placed in multiwell dishes that did not contain a glial monolayer and incubated with REX IgG versus a nonrelevant (NR) IgG (both IgGs at final concentration of 15 μg/ml), 9651 antiserum (ser) versus a nonrelevant antiserum (sera at 1:100 dilution), or with the 192 monoclonal antibody versus a nonrelevant monoclonal antibody (monoclonals at final concentration of 0.2 μg/ml). Development was compared after 18 hr with control cells (100%) and with neurons incubated with NGF (100 ng/ml). Data are means ± SEM for three to seven different cultures in which 50 cells per coverslip were analyzed for two (REX and 192) or four (9651) coverslips per treatment. *p < 0.01, statistically significant differences; ANOVA.
Fig. 5.
Fig. 5.
Time and dose dependence of C6-NBD-Cer formation after incubation with NGF. A, Neurons were incubated for 1 hr with C6-NBD-SM before addition of NGF (200 ng/ml). C6-NBD-Cer formation was calculated as described in Materials and Methods. Data are means ± SEM from five experiments. Note that, as the amount of C6-NBD-SM hydrolyzed to C6-NBD-Cer increases, more C6-NBD-SM transfers from the medium to the neurons (Futerman and Pagano, 1992), with an approximately linear relationship between the amount of cell-associated C6-NBD-SM and the amount of C6-NBD-Cer formed. The slope of NGF-treated cells is significantly different from that of control cells (p < 0.05). B, Neurons were incubated for 1 hr with C6-NBD-SM, followed by an additional 12 min incubation with various concentrations of NGF, before analysis of C6-NBD-Cer formation. Note that, after 12 min incubation, essentially no C6-NBD-GlcCer is synthesized from C6-NBD-Cer, and the data were therefore not corrected to take into account synthesis of C6-NBD-GlcCer and resynthesis of C6-NBD-SM (see Materials and Methods). Data are means ± SEM from three independent experiments.C, Comparison of the effects of NGF and the NGFtm on C6-NBD-Cer formation. Neurons were incubated for 1 hr with C6-NBD-SM and for a further 1 hr with 200 ng/ml NGF or NGFtm before analysis of C6-NBD-Cer formation. *p < 0.01, statistically significant differences; ANOVA.
Fig. 6.
Fig. 6.
Effect of scyphostatin on C6-NBD-Cer formation. A, Rat embryonic cerebral cortex was homogenized in TK buffer, pH 7.4 (with or without 10 mm MgCl2) or in 10 mm MES buffer, pH 4.7, for analysis of SMase activities. Homogenates (20 μg of protein) were incubated for 15 min with scyphostatin (dissolved in ethanol; corresponding amounts of ethanol were added to control samples), followed by a 30 min incubation with 10 μmC6-NBD-SM. After terminating the reaction, C6-NBD-Cer formation was analyzed. Results are means ± SEM of three independent experiments. The slope of A-SMase activity is significantly different from that of N-SMase activity (with or without Mg) (p < 0.0001).B, Top, Coverslips containing neurons were placed in dishes that did not contain a glial monolayer and incubated for 1 hr with or without scyphostatin (1 μm), followed by an additional 1 hr incubation after addition of 1.5 μm C6-NBD-SM. NGF (100 ng/ml) was then added and, after a further 1 hr, the amount of C6-NBD-Cer formed was analyzed. Data are means ± SEM for three independent experiments. Bottom, Neuronal morphology was analyzed 18 hr after adding reagents. Results are means of the number of cells in stage 3 as a percent of the control ± SEM for three different cultures in which 50 cells per coverslip were analyzed for four coverslips per treatment (bottom). *p < 0.01, statistically significant differences; ANOVA.

Similar articles

Cited by

References

    1. Adam-Klages S, Adam D, Wiegmann K, Struve S, Kolanus W, Schneider-Morgener J, Kronke M. FAN, a novel WD-repeat protein, couples the p55 TNF-receptor to neutral sphingomyelinase. Cell. 1996;86:937–947. - PubMed
    1. Akar CA, Wallace WC. Amyloid precursor protein modulates the interaction of nerve growth factor with p75 receptor and potentiates its activation of trkA phosphorylation. Brain Res Mol Brain Res. 1998;56:125–132. - PubMed
    1. Anton ES, Weskamp G, Reichardt LF, Mathew WD. Nerve growth factor and its low-affinity receptor promote Schwann cell migration. Proc Natl Acad Sci USA. 1994;91:2795–2799. - PMC - PubMed
    1. Bamji SX, Majdan M, Pozniak CD, Belliveau DJ, Aloyz R, Kohn J, Causing CG, Miller FD. The p75 neurotrophin receptor mediates neuronal apoptosis and is essential for naturally occurring sympathetic neuron death. J Cell Biol. 1998;140:911–923. - PMC - PubMed
    1. Barbacid M. Structural and functional properties of the Trk family of neurotrophin receptors. Ann NY Acad Sci. 1995;766:442–558. - PubMed

Publication types

MeSH terms