. 1999 Oct 1;19(19):8528-41.
doi: 10.1523/JNEUROSCI.19-19-08528.1999.

Ca(2+)-permeable AMPA receptors and spontaneous presynaptic transmitter release at developing excitatory spinal synapses

Affiliations

Ca(2+)-permeable AMPA receptors and spontaneous presynaptic transmitter release at developing excitatory spinal synapses

J Rohrbough et al. J Neurosci. .

Abstract

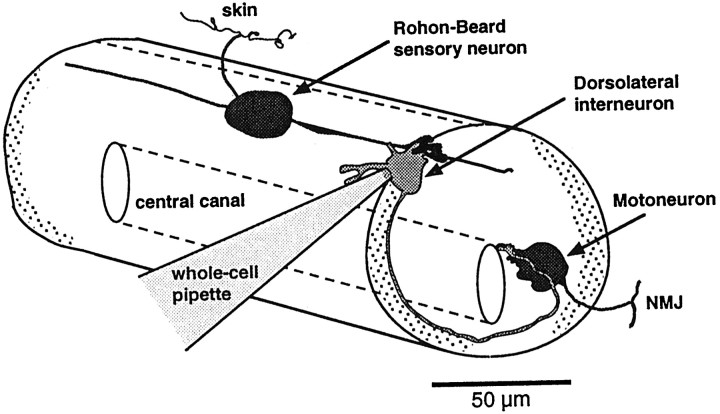
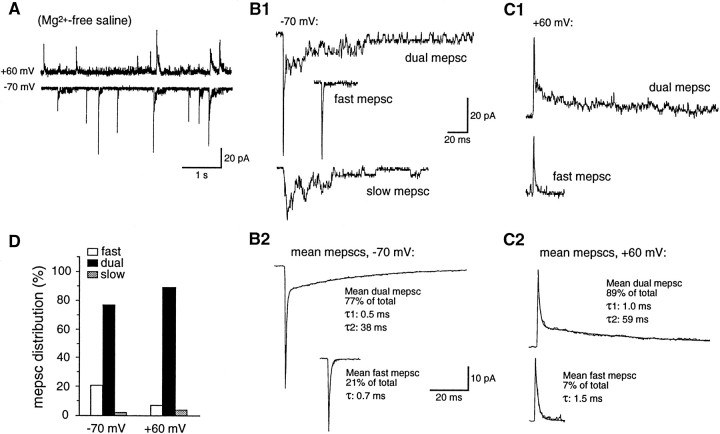
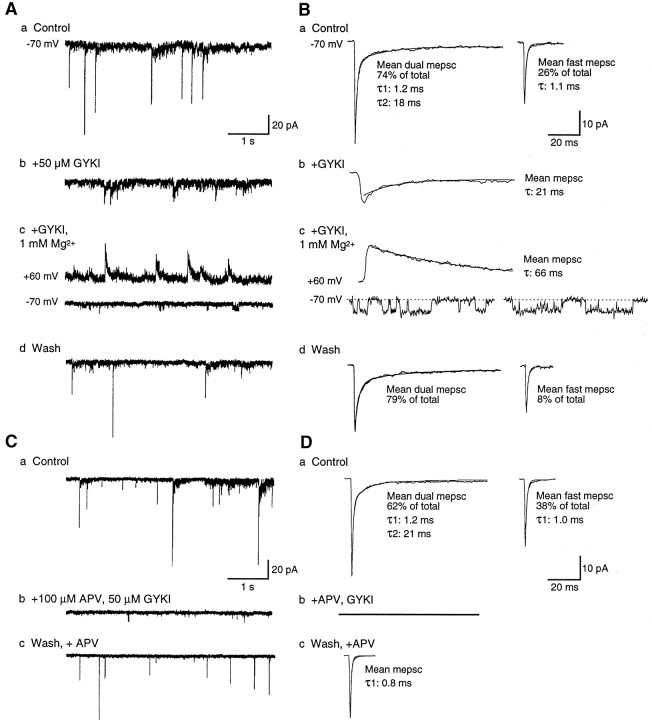
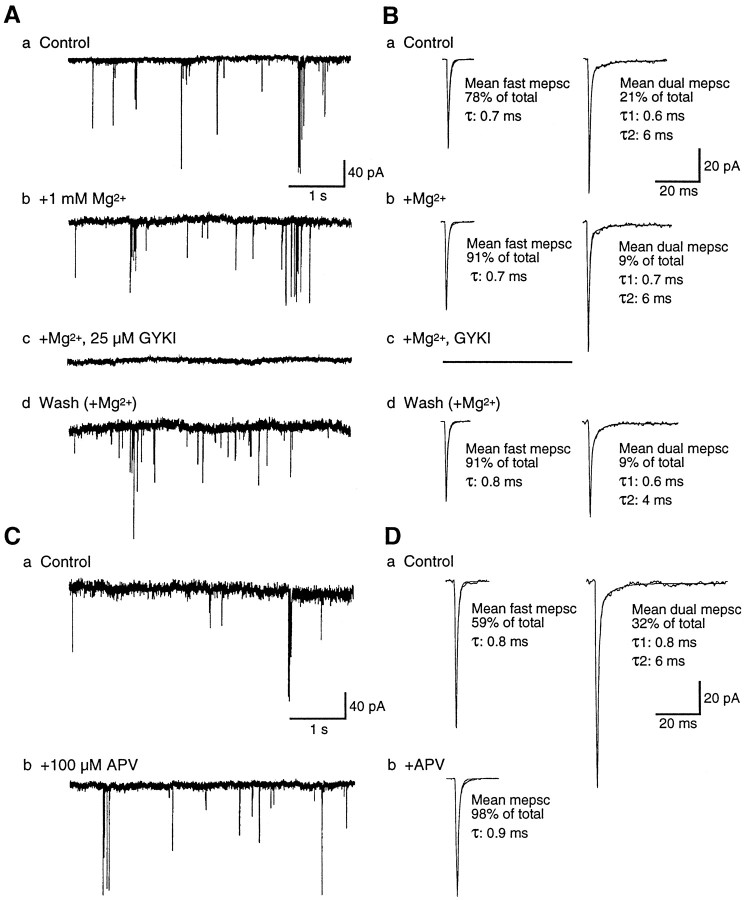
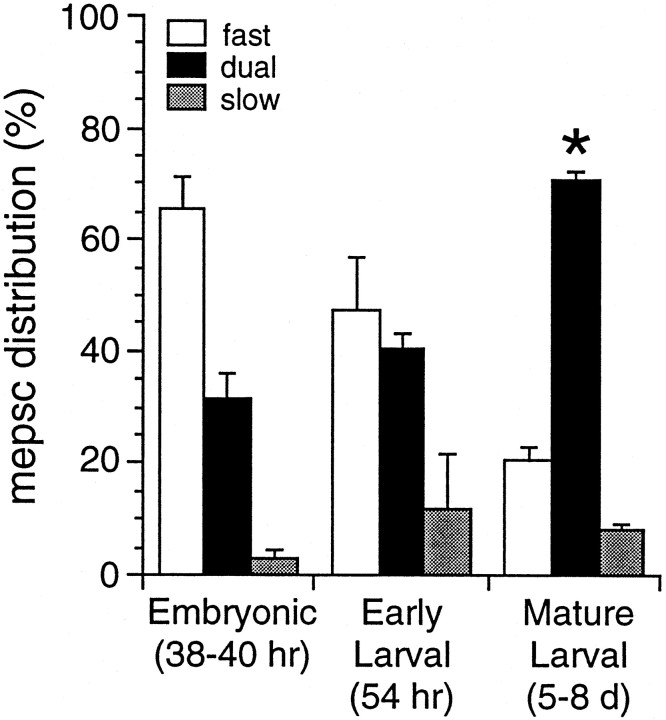
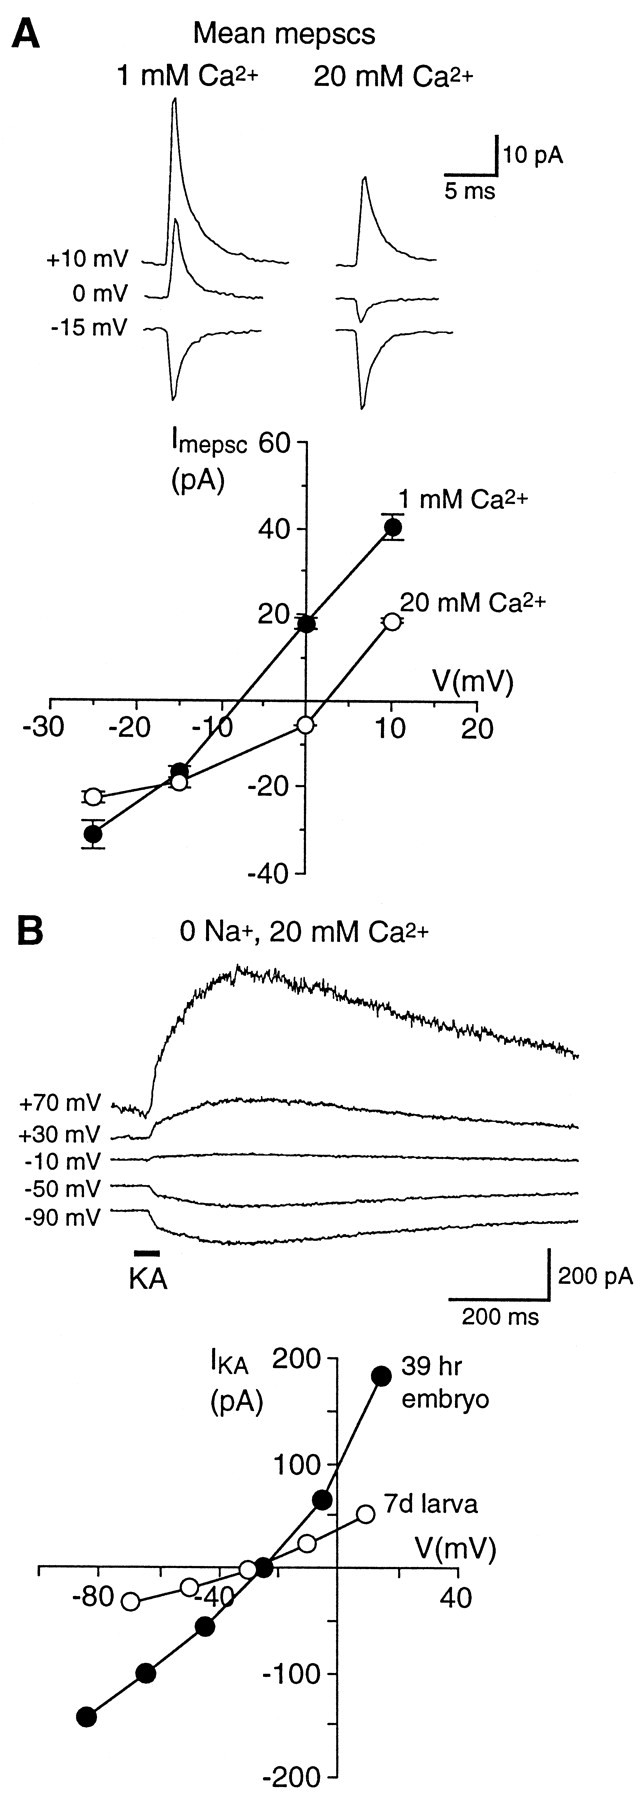
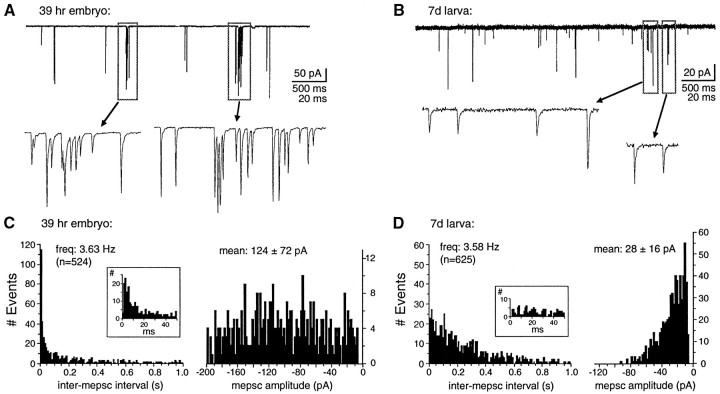
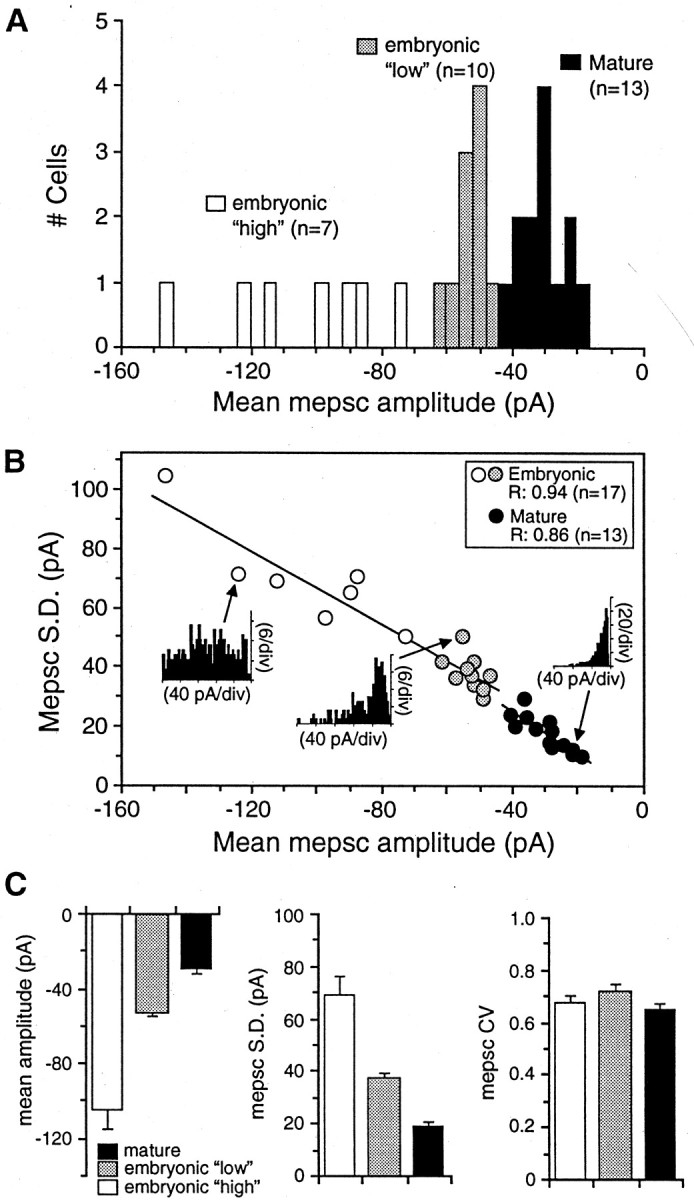
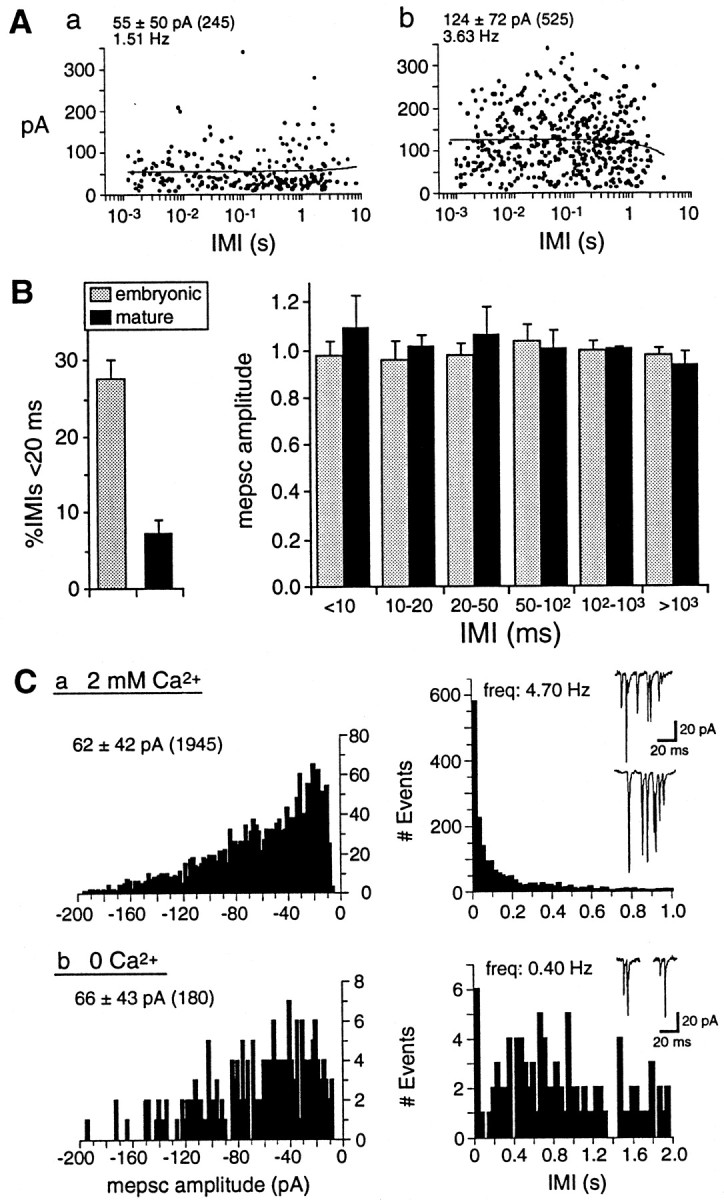
At many mature vertebrate glutamatergic synapses, excitatory transmission strength and plasticity are regulated by AMPA and NMDA receptor (AMPA-R and NMDA-R) activation and by patterns of presynaptic transmitter release. Both receptors potentially direct neuronal differentiation by mediating postsynaptic Ca(2+) influx during early development. However, the development of synaptic receptor expression and colocalization has been examined developmentally in only a few systems, and changes in release properties at neuronal synapses have not been characterized extensively. We recorded miniature EPSCs (mEPSCs) from spinal interneurons in Xenopus embryos and larvae. In mature 5-8 d larvae, approximately 70% of mEPSCs in Mg(2+)-free saline are composed of both a fast AMPA-R-mediated component and a slower NMDA-R-mediated decay, indicating receptor colocalization at most synapses. By contrast, in 39-40 hr embryos approximately 65% of mEPSCs are exclusively fast, suggesting that these synapses initially express predominantly AMPA-R. In a physiological Mg(2+) concentration (1 mM), mEPSCs throughout development are mainly AMPA-R-mediated at negative potentials. Embryonic synaptic AMPA-R are highly Ca(2+)-permeable, mEPSC amplitude is over twofold larger than at mature synapses, and mEPSCs frequently occur in bursts consistent with asynchronous multiquantal release. AMPA-R function in this motor pathway thus appears to be independent of previous NMDA-R activation, unlike other regions of the developing nervous system, ensuring a greater reliability for embryonic excitatory transmission. Early spontaneous excitatory activity is specialized to promote AMPA-R-mediated synaptic Ca(2+) influx, which likely has significant roles in neuronal development.


Figures

Fig. 1.
Fig. 1.
Excitatory synapses on dorsolateral interneurons (DLi) are examined in intact Xenopus embryonic and larval spinal cords. A schematic representation of neurons in the early larval spinal cord is shown. Glutamatergic mEPSCs described in this study originate from Rohon–Beard cells. The DLi also receive inhibitory input from other interneurons (data not shown) and make excitatory connections onto motoneurons. Whole-cell recordings were made between developmental stages 31 (39 hr after fertilization) and 48 (7–8 d) from interneurons identified by the superficial location of their cell bodies in the dorsolateral spinal cord.
Fig. 2.
Fig. 2.
mEPSCs recorded from mature excitatory synapses are predominantly dual component in Mg2+-free saline. A, Continuous traces of mEPSCs recorded at −70 mV (bottom trace) and +60 mV (top trace). All recordings in this and subsequent figures were made in the presence of TTX (0.1 μg/ml), strychnine (1 μm), and bicuculline (50 μm) to block action potentials and mIPSCs. B, C, Examples of dual-component (dual mEPSCs), fast, and slow mEPSCs recorded at −70 mV (B1) and dual and fast mEPSCs recorded at +60 mV (C1). Dual mEPSCs, consisting of a fast initial current component followed by a variable slow decay, predominated at both potentials. B2, C2, Mean dual-component (n = 113, −70 mV;n = 49, +60 mV) and fast mEPSCs (n = 34, −70 mV; n = 3, +60 mV); slow mEPSCs were too infrequent to construct an average. Single-exponential (fast mEPSCs) and double-exponential (dual mEPSCs) fits are superimposed on the mean mEPSC traces. D, Distribution of fast, dual-component, and slow mEPSCs at both potentials. All data are from a single DLi in a 6 d larva.
Fig. 3.
Fig. 3.
mEPSCs at mature excitatory spinal synapses are mediated by both AMPA-R and NMDA-R. A, B, GYKI and Mg2+ selectively block the fast and slow mEPSC components, respectively. A, Continuous traces of mEPSCs recorded at −70 or +60 mV, as indicated. B, Mean mEPSCs are shown for each corresponding segment of the recording.a, Dual-component mEPSCs predominate in control 0-Mg2+ saline. b, GYKI blocks fast mEPSCs and the fast component of dual mEPSCs; the mean mEPSC has a slow decay constant comparable to the slow component of the mean dual mEPSC in a. c, In the continued presence of GYKI the addition of Mg2+ blocks all mEPSCs at −70 mV (lower trace), although occasional single channel openings of 4–5 pA are observed that may be attributable to synaptic NMDA-R. At depolarized potentials (+60 mV; upper trace), outward mEPSCs with prolonged decay constants are evident. These results indicate that fast mEPSC components are mediated by AMPA-R, and the slow component is mediated by NMDA-R. d, Both dual-component and fast mEPSCs are recorded after >8 min washout of GYKI and Mg2+. C, D, APV selectively abolishes the slow mEPSC component. Traces (C) and averaged mEPSCs (D) at −70 mV are illustrated as in A and B.a, Dual-component and fast mEPSCs recorded in control 0-Mg2+ saline. b, In the presence of APV and GYKI all mEPSCs are abolished. c, After the washout of GYKI in the continued presence of APV, only fast mEPSCs are observed, which are indistinguishable from fast mEPSCs observed in control saline. A, B and C, D were recorded from two cells in different mature 7 d larvae; the recording in A and B was made in the presence of 10 μm glycine, which did not change the distributions of mEPSCs significantly (n = 4). Mean fast mEPSCs are averages of 7–21 events; other mean mEPSCs are averages of >50 events.
Fig. 4.
Fig. 4.
mEPSCs at embryonic excitatory spinal synapses are mediated primarily by AMPA-R. A, B, GYKI and Mg2+ selectively block the fast and slow embryonic mEPSC components, respectively. A, Continuous traces of mEPSCs recorded at −70 mV. B, Mean mEPSCs for each corresponding segment of the recording. a, Fast mEPSCs predominate in control 0-Mg2+ saline, and the slow component of dual mEPSCs is proportionately smaller and briefer than in mature mEPSCs (see Fig. 3B). b, The addition of Mg2+ reduces the incidence of dual mEPSCs to <10%. c, All mEPSCs are abolished in the presence of Mg2+plus GYKI. d, After the washout of GYKI, fast mEPSCs again predominate. C, D, APV reveals a minor NMDA-R-mediated component in embryonic dual mEPSCs. Continuous traces (C) and averaged mEPSCs (D) at −70 mV are illustrated as inA and B. a, The majority of mEPSCs recorded in control 0-Mg2+ saline are fast. b, In the presence of APV only fast mEPSCs remain, which are indistinguishable from the fast control mEPSCs. A, B and C, D were recorded from two cells in different stage 31/32 (39–40 hr) embryos. Mean mEPSCs are averages of ≥49 events (fast) and ≥18 events (dual).
Fig. 5.
Fig. 5.
The distribution of different classes of mEPSCs changes during embryonic and larval development. The mean percentages ± SEM of fast, dual, and slow mEPSCs recorded at −70 mV in Mg2+-free external saline are plotted for three developmental stages. The incidence of dual, AMPA-R- and NMDA-R-mediated, mEPSCs increases to >70% at mature synapses, and the incidence of fast AMPA-R-mediated mEPSC decreases. The percentage of dual mEPSCs in mature larvae (asterisk; 71 ± 2%;n = 12) is significantly greater than the values at both embryonic (38–40 hr; n = 5) and larval stages (54 hr; n = 6).
Fig. 6.
Fig. 6.
Embryonic synaptic AMPA-R and the total AMPA-R population in both embryonic and mature larval DLi are Ca2+-permeable. A,Top, Mean AMPA-R-mediated mEPSCs recorded in 1 and 20 mm external Ca2+ at three holding potentials from a DLi in a stage 31 (39 hr) embryo. Mg2+ (1 mm) and APV (50 μm) were present to isolate AMPA-R. Note that the mean mEPSCs at 0 mV have opposite polarity at the two Ca2+ concentrations. A,Bottom, mEPSC I–V relations in 1 and 20 mm Ca2+ for the same cell. The mEPSC reversal potential (determined by interpolation) in 20 mmCa2+ is shifted by +10.5 mV, indicating a significant Ca2+ permeability for synaptic AMPA-R (estimated PCa of 1.8 relative to monovalent cations). B, Whole-cell responses to kainate (KA) in 0-Na+, 20 mmCa2+ external saline support the conclusion that the AMPA-R population (synaptic plus nonsynaptic) is permeable to Ca2+. B,Top, Currents evoked by 500 μm KA focally applied with a pressure pipette (horizontal bar) in 0-Na+, 20 mm Ca2+saline to a DLi in a stage 31 embryo. B, Bottom, The KAI–V in 0-Na+, 20 mmCa2+ is shown for the same embryonic neuron (filledsymbols); the KA reversal potential is −22 mV, and the estimated relativePCa for AMPA-R is 1.5. Open symbols show the KA I–V in 0-Na+, 20 mm Ca2+ for a DLi in a mature (7 d) larva; the reversal potential is −30 mV, and estimated relative PCa is 1.0.
Fig. 7.
Fig. 7.
AMPA-R-mediated mEPSCs at embryonic synapses occur in spontaneous bursts and have large amplitudes, both of which are absent at mature synapses. A, B, Continuous records (top traces) of mEPSCs recorded at −70 mV in 1 mm Mg2+ from an embryonic neuron (A) and a mature neuron (B). Note the difference in amplitude scales. Portions of the continuous traces contained in the boxedregions are shown on an expanded time scale (bottom set of traces). Many mEPSCs at embryonic synapses occur in bursts separated by brief intervals (A, bottom trace) even when the overall frequency is low, whereas at mature synapses (B, bottom trace) such bursts are absent. C, D, Inter-mEPSC interval (IMI) distributions (left panels) and mEPSC amplitude distributions (right panels) for the cells illustrated in A and B. The proportion of brief IMIs (1–20 msec durations) is markedly greater at the embryonic synapse (C) than at the mature synapse (D) because of events occurring in bursts, although both cells had the same overall mEPSC frequency; note the different scale of ordinates. Insets show distributions of IMIs <50 msec in each cell in greater detail. All embryonic neurons had disproportionately greater numbers of brief IMIs. Embryonic mEPSCs have significantly greater amplitudes and variability than mature mEPSCs. Values above IMI distributions are overall frequency and number of events; values above amplitude distributions are mean amplitude ± SD.
Fig. 8.
Fig. 8.
mEPSC amplitude and variability decrease with development. A, Histogram of mean mEPSC amplitudes recorded from embryonic and mature neurons (−70 mV; 1 mmMg2+). Mean mEPSC amplitudes at 13 mature synapses are tightly grouped (filled bars), with an average value of −30 ± 2 pA (n = 13). Embryonic mean mEPSC amplitudes appear to fall into two populations: a “low” group (n = 10; shaded bars) and a “high” group (n = 7;open bars), with an overall average amplitude of −74 ± 7 pA. B, Variability (SD) in mEPSC amplitude is plotted against the mean amplitude for 17 embryonic and 13 mature neurons. mEPSC variability is correlated strongly and positively with mean mEPSC amplitude; regression values in the panel inset were determined from straight line fits to the data. A much wider range of mEPSC amplitudes and variability is observed in embryonic neurons, which are plotted in two groups, as inA. Inset histograms show representative mEPSC amplitude distributions for a neuron from each group.C, Mean mEPSC amplitudes (left panel), variability in amplitude (SD, middle panel), and coefficients of variability ± SEM (CV;right panel) for the two embryonic groups and mature neurons shown in A and B. Mean mEPSC amplitude and variability are significantly larger in both embryonic groups than in mature mEPSCs, but there is no significant difference in CV during development.
Fig. 9.
Fig. 9.
Ca2+-dependent unsynchronized multiquantal release underlies mEPSC bursts at embryonic synapses.A, B, mEPSC amplitude at embryonic and mature synapses is independent of spontaneous frequency. A, Scatter plot of mEPSC amplitudes versus mEPSC intervals (IMI, in log scale) preceding each event for two embryonic neurons from the “low” (a) and “high” amplitude groups (b) shown in Figure 8. Mean mEPSC amplitudes ± SD, number of events, and frequency in each neuron are shownabove the plots. mEPSCs occurring during bursts are those preceded by brief duration IMIs (<20 msec). There is no correlation between mEPSC amplitude and IMI, demonstrating that mEPSCs within and outside of bursts have similar amplitudes; lines were fit to the data by linear regression (r = 0.008,a; r = −0.053, b).B, Left, The proportion of brief duration IMIs (<20 msec) is significantly larger for embryonic (28 ± 3%) than for mature (7 ± 2%) synapses. Mean mEPSC frequencies ± SEM for the data shown are 3.3 ± 1.1 Hz for embryonic neurons (range, 0.7–9.9 Hz; n = 8) and 3.3 ± 1.3 Hz for mature neurons (range, 0.7–13.4 Hz; n = 9).B, Right, mEPSC amplitudes (normalized to the mean value in each recording ± SEM) are plotted against IMI bins of increasing duration for embryonic (n = 8) and mature neurons (n = 9). There is no significant difference in mEPSC amplitudes over a 1000-fold range of IMI duration, indicating that amplitude is not affected by intrinsic release frequency. C, Reducing the probability of spontaneous release eliminates most spontaneous bursts but does not alter mEPSC amplitude and variability. mEPSC amplitude (left plots) and IMI distributions (right plots) are shown for an embryonic neuron (40 hr) in normal 2 mmCa2+ (a) and 0-Ca2+ saline (b). Mean amplitudes ± SD, number of events, and frequency for both conditions are shown above the plots. mEPSC amplitude and variability are not significantly different in 0-Ca2+ saline, but mEPSC frequency is reduced to <10% of control, and bursts of >2 mEPSCs are eliminated. Examples of normal mEPSC bursts and rare doublets in 0-Ca2+ areinsetabove the IMI histograms.

Similar articles

Cited by

References

    1. Auger C, Kondo S, Marty A. Multivesicular release at single functional sites in cerebellar stellate and basket cells. J Neurosci. 1998;18:4532–4547. - PMC - PubMed
    1. Bekkers JM, Stevens CF. NMDA and non-NMDA receptors are colocalized at individual excitatory synapses in cultured rat hippocampus. Nature. 1989;341:230–233. - PubMed
    1. Bekkers JM, Stevens CF. Quantal analysis of EPSCs recorded from small numbers of synapses in hippocampal cultures. J. Neurophysiol. 1995;73:1145–1156. - PubMed
    1. Bekkers JM, Richerson GB, Stevens CF. Origin of variability in quantal size in cultured hippocampal neurons and hippocampal slices. Proc Natl Acad Sci USA. 1990;87:5359–5362. - PMC - PubMed
    1. Ben-Ari Y, Khazipov R, Leinekugel X, Caillard O, Gaiarsa JL. GABAA, NMDA, and AMPA receptors: a developmentally regulated “menage a trois.”. Trends Neurosci. 1997;20:523–529. - PubMed

MeSH terms

LinkOut - more resources