. 1999 Oct 1;19(19):8560-72.
doi: 10.1523/JNEUROSCI.19-19-08560.1999.

The representation of illusory and real contours in human cortical visual areas revealed by functional magnetic resonance imaging

Affiliations

The representation of illusory and real contours in human cortical visual areas revealed by functional magnetic resonance imaging

J D Mendola et al. J Neurosci. .

Abstract

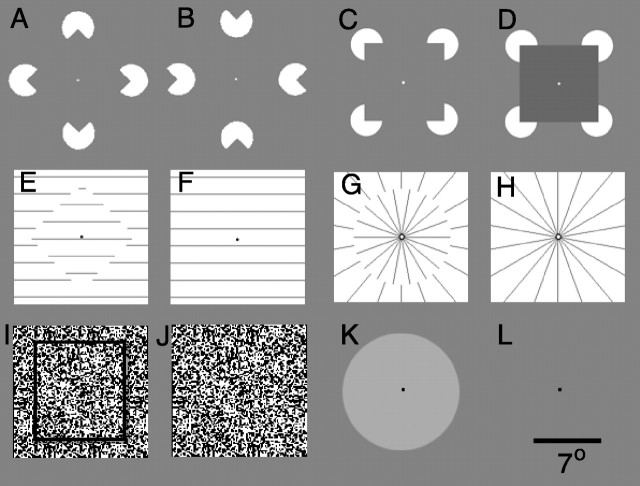
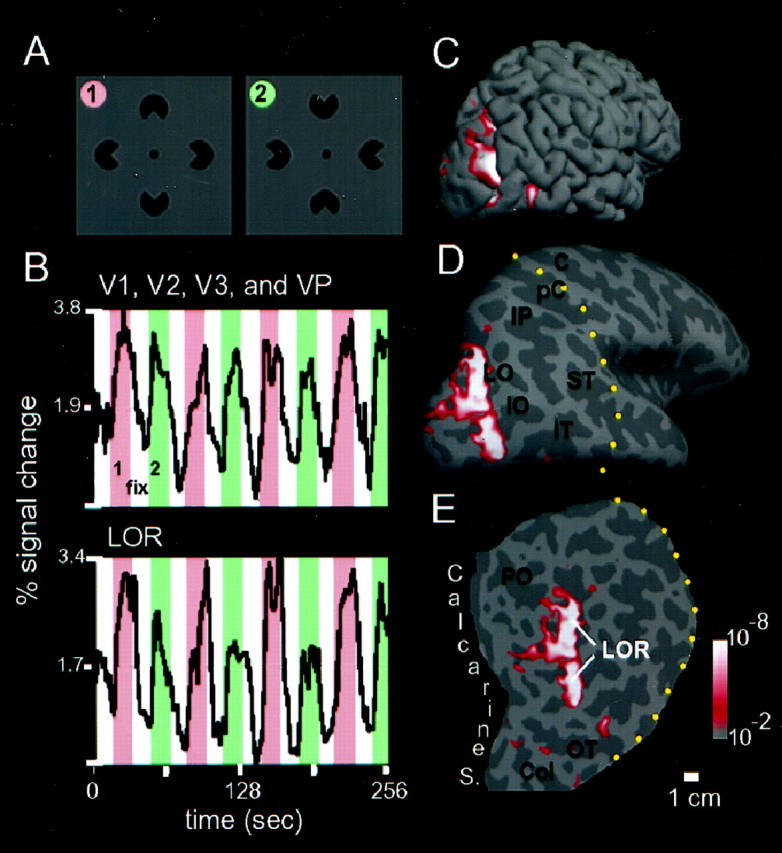
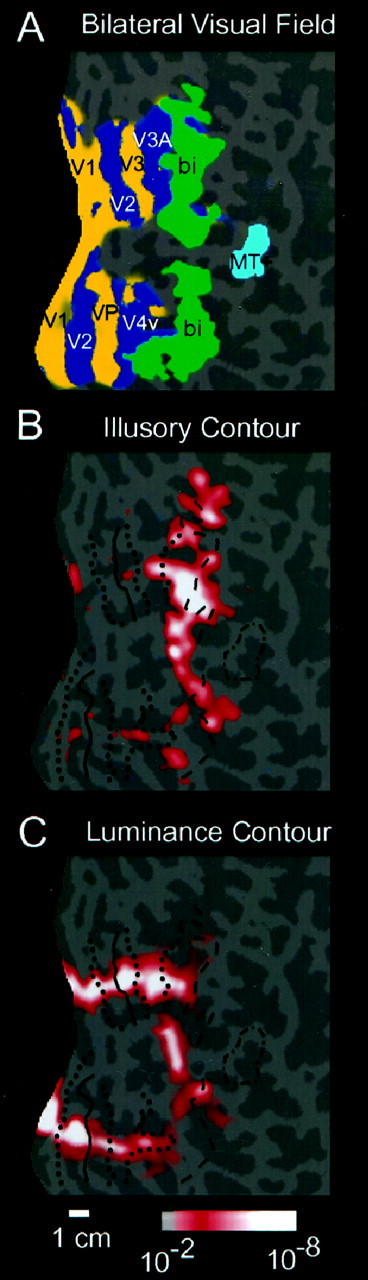
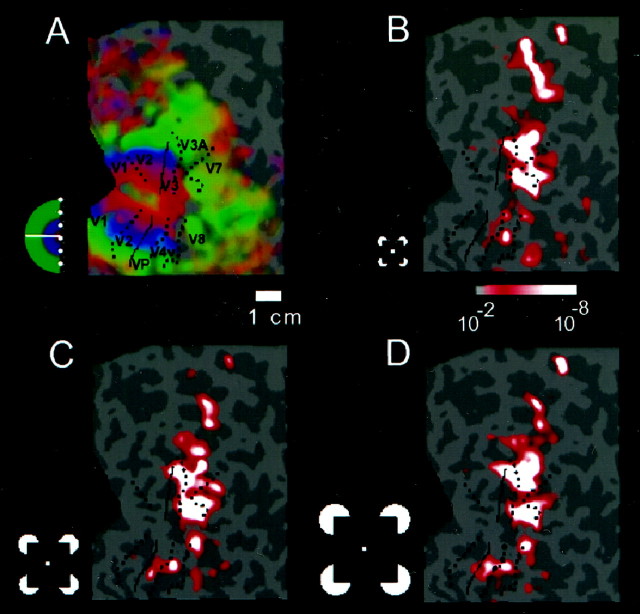
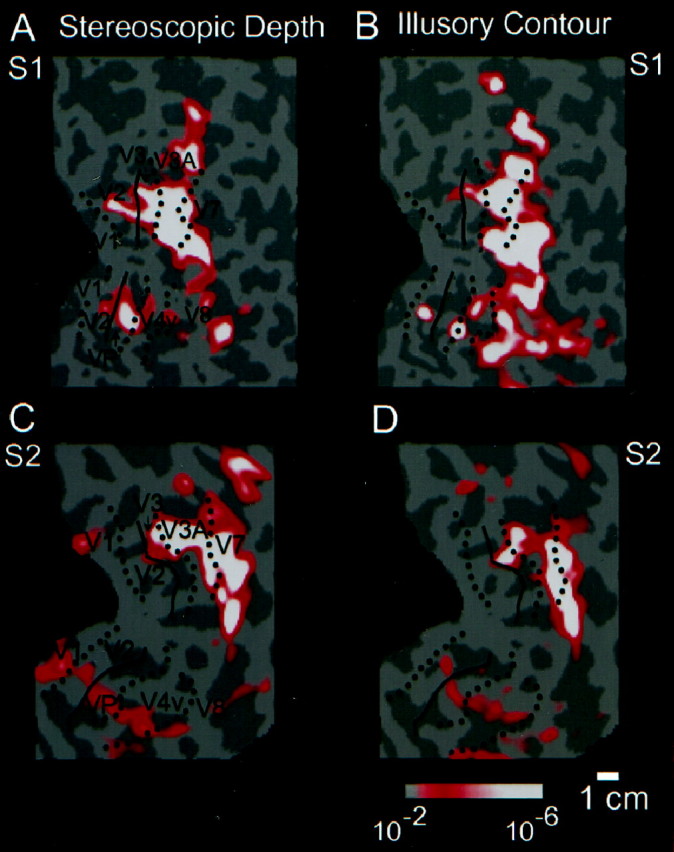
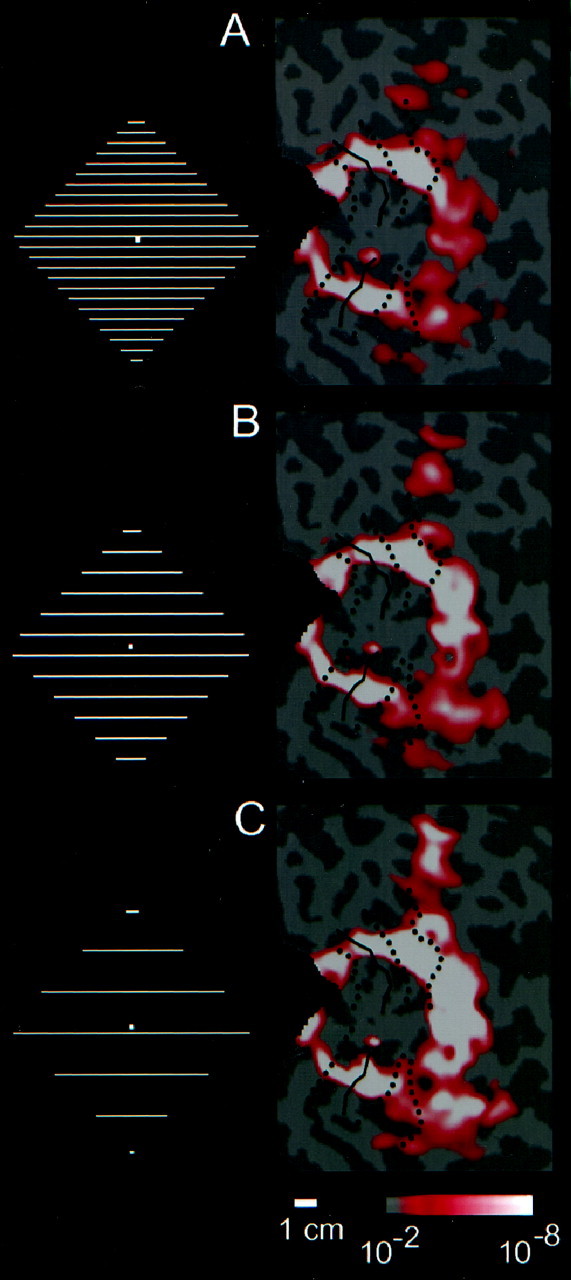
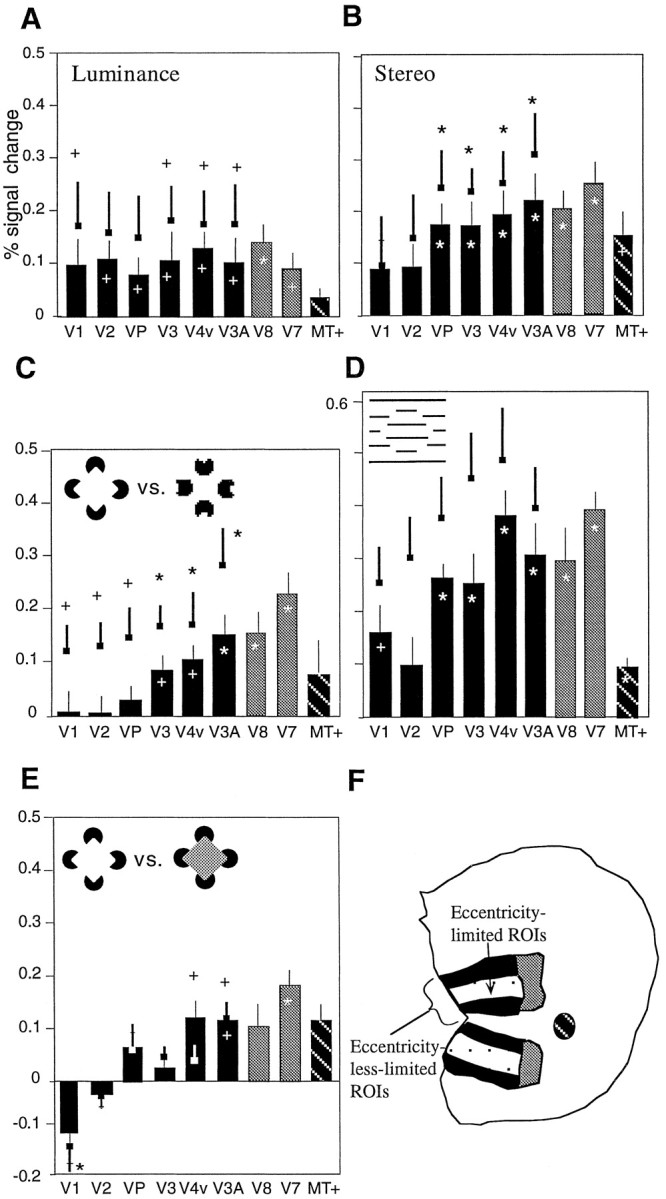
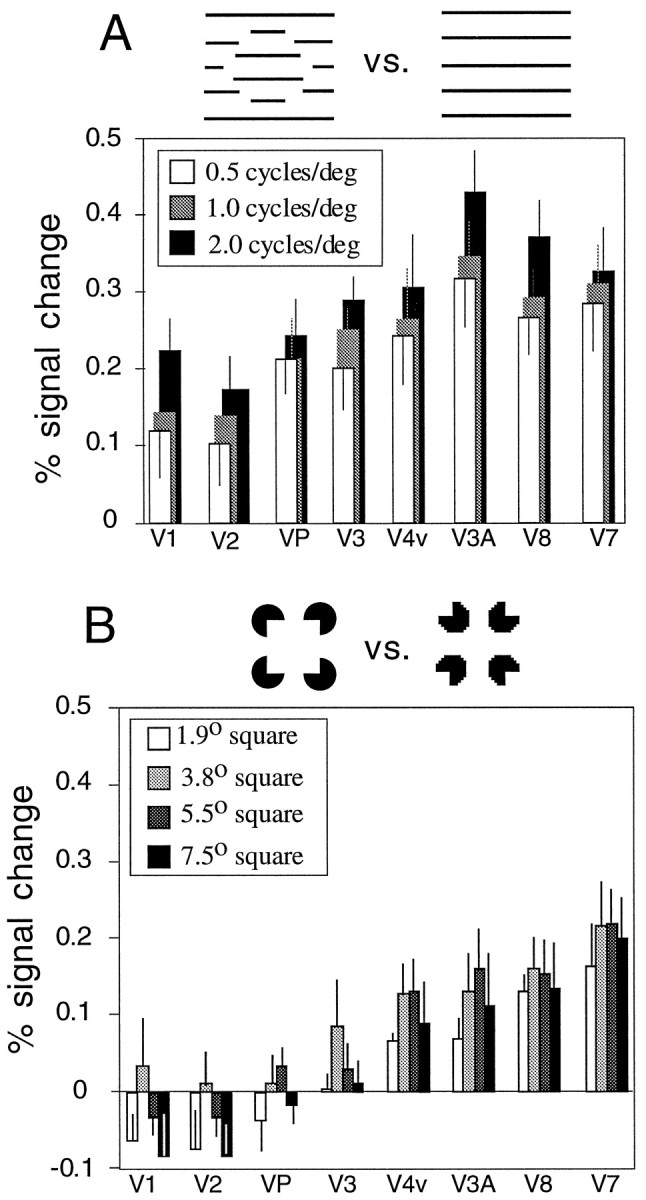
Illusory contours (perceived edges that exist in the absence of local stimulus borders) demonstrate that perception is an active process, creating features not present in the light patterns striking the retina. Illusory contours are thought to be processed using mechanisms that partially overlap with those of "real" contours, but questions about the neural substrate of these percepts remain. Here, we employed functional magnetic resonance imaging to obtain physiological signals from human visual cortex while subjects viewed different types of contours, both real and illusory. We sampled these signals independently from nine visual areas, each defined by retinotopic or other independent criteria. Using both within- and across-subject analysis, we found evidence for overlapping sites of processing; most areas responded to most types of contours. However, there were distinctive differences in the strength of activity across areas and contour types. Two types of illusory contours differed in the strength of activation of the retinotopic areas, but both types activated crudely retinotopic visual areas, including V3A, V4v, V7, and V8, bilaterally. The extent of activation was largely invariant across a range of stimulus sizes that produce illusory contours perceptually, but it was related to the spatial frequency of displaced-grating stimuli. Finally, there was a striking similarity in the pattern of results for the illusory contour-defined shape and a similar shape defined by stereoscopic depth. These and other results suggest a role in surface perception for this lateral occipital region that includes V3A, V4v, V7, and V8.


Figures

Fig. 1.
Fig. 1.
Stimuli used in the experiments. An example is shown from the experimental and from the control epoch of each stimulus comparison. A,B, Aligned inducers (Kanizsa) versus rotated inducers; C, D, aligned (Kanizsa) inducers versus aligned inducers with luminance occluder;E,F, displaced-grating illusory contour versus nondisplaced grating; G,H, radial displaced-grating illusory contour versus nondisplaced radial grating;I,J, stereopsis-defined shape versus random-dot background; K,L,luminance-defined shape versus fixation point alone. The square outline and shadow in I were not present in the actual stimuli; they have been added here to clarify the nature of the stereo-based stimuli. The scale bar indicates the size of the stimuli, in degrees of visual angle.
Fig. 2.
Fig. 2.
FMRI signal across time for the Kanizsa comparison in four retinotopic areas and in the lateral occiptial region (LOR), in subject N.K. A, The stimulus comparison was between aligned inducers (1) and rotated inducers (2). B, The average time course of all the voxels that fell within the areas V1, V2, V3, and VP (top graph) is compared with the average time course of all the voxels that fell within the LOR (shown inC–E) defined by activation in the stimulus comparison shown in A (bottom graph). For both graphs, the experimental epochs are indicated by pink, the control epochs by green, and an interposed period of blank screen with fixation point is labeled with white. Visual areas V1, V2, V3, and VP show a similar-sized response to both aligned and rotated inducers, whereas the experimentally defined region anterior to those retinotopic areas shows a stronger response to aligned than to rotated inducers. C–E, Regions of cortex that respond more to the aligned inducers versus rotated inducers are shown with a redp ≤ 10−2 to white p ≤ 10−6 color scale, in the right hemisphere. The normally folded cortical surface (C) has been inflated (D) so that sulci and gyri are equally visible. Cortical gyri and sulci are uniformly light anddark gray, respectively. The dotted yellow lines in D and E show the lateral aspect of the cut that was made to isolate the posterior pole.E, The posterior third of the cortex is shown in flattened format, and the scale bar indicates an approximate distance on the cortical surface. The inflated posterior pole, which is approximately cone-shaped in its normal folded state, has been opened along the calcarine sulcus and unfolded. In D andE some of the notable sulci are labeled with abbreviations: C, central sulcus; PC,postcentral sulcus; IP, intrapvarietal sulcus;LO, lateral occipital sulcus; ST,superior temporal sulcus; IT, inferior temporal sulcus;PO, parieto-occipital sulcus; OT,occipitotemporal sulcus; Co, collateral sulcus. The distance scale bar (1 cm) applies to E.
Fig. 3.
Fig. 3.
Relation of illusory contour signals to the borders of visual areas and other functional landmarks on the flattened cortical surface from subject B.K. A, The field sign map is shown, including the classically retinotopic areas (V1, V2, V3/VP, V3A, and V4v) in the left hemisphere. The left hemisphere has been left-right reversed to aid comparison with other figures. Areas coloreddark blue represent the visual field in its normal polarity, whereas areas colored yellow represent a mirror-reversed visual field. Also indicated in A(green) is the activation obtained (above a significance threshold of p = 10−2) in a previous experiment that labeled bilaterally responsive cortex sensitive to naturalistic scenes of objects and landscapes (Tootell et al., 1998a), as well as the activation acquired in another experiment that labeled the motion-sensitive area MT+ (Tootell et al., 1995) (light blue, significance threshold of p = 10−2). B shows the extent of activation produced by a luminance contour compared with the uniform gray control stimulus. Functional landmarks from the same subject have been overlaid. Horizontal meridian representations are drawn withsolid lines; vertical meridians are shown bydotted lines. Area MT+ and the anterior border of the bilaterally labeled region are indicated with dashed lines. Other conventions are as described in previous figures.B shows regions of cortex that respond more to aligned inducers than to rotated inducers. The overlap between this region and the bilateral cortex shown in A is extensive. The comparison between B and Cshows that the luminance contour activated the lower-tier retinotopic areas more strongly than the illusory contours.
Fig. 4.
Fig. 4.
FMRI response to illusory contour stimuli of a common type but varying in size. A–D show flat maps of the right posterior pole from the subject J.M. A shows a map of phase-encoded retinotopic eccentricity along with area boundaries derived from the field sign map. As indicated by the logo, foveal eccentricities are labeled in red(∼0–2o), peripheral eccentricities are labeled ingreen (∼6–15°), and intervening eccentricities are labeled in blue (2–6o).B–D show the areas that responded more to the aligned inducers than to the rotated inducer control, for three sizes of illusory shape (3.8, 5.5, and 7.5°, respectively; see stimulus logos in each panel). The activation patterns were remarkably consistent across a wide variation in stimulus size. See previous figures for other conventions.
Fig. 5.
Fig. 5.
Comparison of isoeccentric stereopsis-defined contours versus illusory contours on the flattened cortical surface of two subjects. A and B show data from one subject (S1; J.M.), whereas C andD show data from a second subject (S2;T.W.). A, C, These panels show regions of cortex that respond more to an isoeccentric shape defined by 0.56° binocular disparity compared with a zero-disparity control, in the right hemispheres of two subjects. Visual area borders are transposed from the field sign map in the same subjects.B, D, These panels show regions of cortex that respond more to an isoeccentric shape defined by aligned (Kanizsa) inducers compared with rotated inducers. Other conventions are as described previously. Both the stereopsis- and illusory-defined shapes activated V3A, and the lateral occipital region anterior to it (i.e., to the right in this figure), to a greater degree than the lower-tier retinotopic areas.
Fig. 6.
Fig. 6.
Comparison of the fMRI signal produced by grating-based illusory contours, across a range of spatial frequencies, in subject J.M. A–C show flat maps of the left occipital cortex in one subject. The activation maps are shown for three spatial frequencies. The three spatial frequencies were 2, 1, and 0.5 cycles/°. The stimulus logo next to each map shows adiamond figure, but not the stimulus background; the actual stimuli are indicated in Figure 2. Other conventions are described in previous figures. Signal strength is similar across spatial frequency in the classical retinotopic areas, but increases with decreasing spatial frequency in the lateral occiptial region anterior to (to the right of) those areas.
Fig. 7.
Fig. 7.
Comparison across subjects in the response of individual visual areas to shapes defined by real and illusory contours. The bar graphs in A–G show the average fMRI signal change for individual visual areas across all subjects tested (A–D, n = 11; E,n = 12; F, n = 9;G, n = 7). Data from corresponding visual areas in the left and right hemispheres areas are averaged together. Error bars indicate SEM. Plus signs and asterisks indicate the signal modulations that are significantly different from zero based ont tests at p < 0.05.Asterisks indicate modulations with pvalues that survive Bonferroni correction. A–G, Thebullets with heavy error bars above each bar indicate the increased modulation that could be detected when the regions of interest were restricted to the 3–9o eccentricity representation in the retinotopic areas. A, B,Isoeccentric contours defined by luminance and stereopsis, respectively. C, Comparison between aligned inducers and rotated inducers. D, Grating-based illusory contour versus nondisplaced grating control (lowest spatial frequency case).E, Aligned inducers versus aligned inducers with luminance occluder. F, The locations of the ROIs are shown on the flattened cortical surface of an individual subject in schematic form. The fMRI signals are strongest in higher-tier areas for the stereopsis-defined shape, and the shapes defined by illusory contours.
Fig. 8.
Fig. 8.
Analysis across subjects of variation of Kanizsa-type stimulus size and displaced-grating stimulus spatial frequency. A,B, Bar graphs show the average fMRI signal change, for individual visual areas, across subjects (A, n = 9;B, n = 5). Corresponding visual areas in the left and right hemispheres areas are averaged together. Error bars indicate SEM. A, Displaced grating versus nondisplaced grating for three spatial frequencies. ANOVA indicates a significant effect of spatial frequency. B, Aligned versus rotated inducers for four Kanizsa square sizes. ANOVA does not show a significant effect of size.

Similar articles

Cited by

References

    1. Collins LD, Neelin P, Peters TM, Evans AC. Automatic 3D inter-subject registration of MR volumetric data in standardized Talairach space. J Comp Assist Tomog. 1994;18:192–205. - PubMed
    1. Dale AM, Sereno MI. Improved localization of cortical activity by combining EEG and MEG with MRI cortical surface reconstruction. J Cognit Neurosci. 1999;5:162–176. - PubMed
    1. Dale AM, Fischl B, Sereno MI. Cortical surface-based analysis I: segmentation and surface reconstruction. NeuroImage. 1999;9:179–194. - PubMed
    1. DeYoe EA, Carmen GJ, Bandettini PA, Glickman S, Wieser J, Cox R, Miller D, Neitz J. Functional magnetic resonance imaging (fMRI) of the human brain. J Neurosci Methods. 1994;54:171–187. - PubMed
    1. DeYoe EA, Bandettini PA, Neitz J, Miller D, Winans P. Mapping striate and extrastriate visual areas in human visual cortex. Proc Natl Acad Sci USA. 1996;93:2382–2386. - PMC - PubMed

Publication types

LinkOut - more resources