. 1999 Oct 1;19(19):8573-88.
doi: 10.1523/JNEUROSCI.19-19-08573.1999.

Electromyographic correlates of learning an internal model of reaching movements

Affiliations

Electromyographic correlates of learning an internal model of reaching movements

K A Thoroughman et al. J Neurosci. .

Abstract

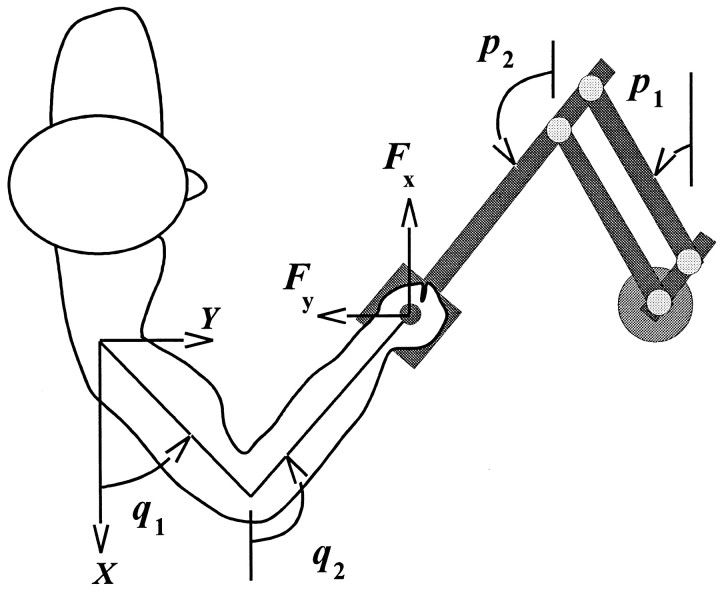
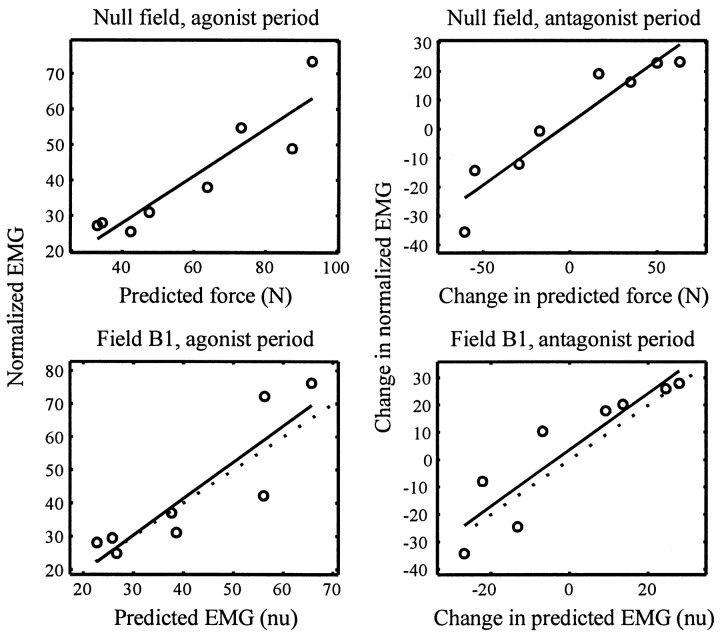
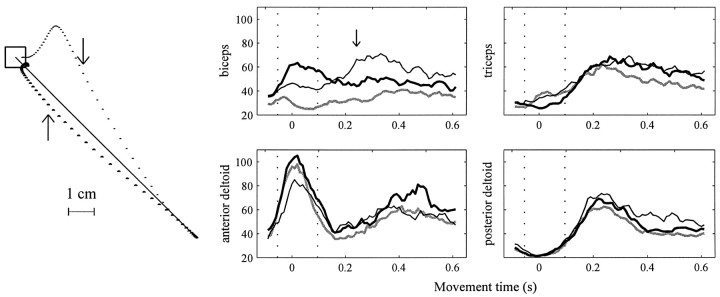
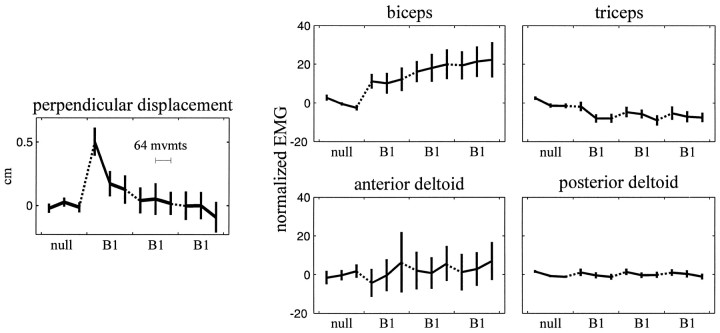
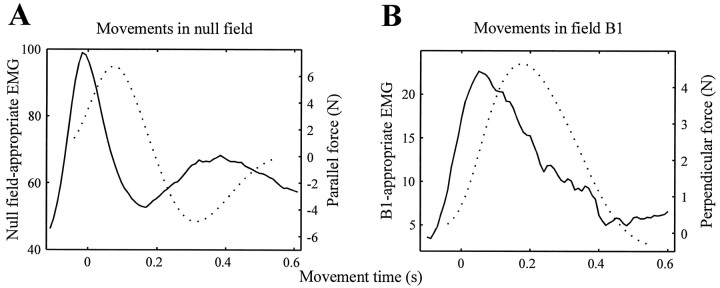
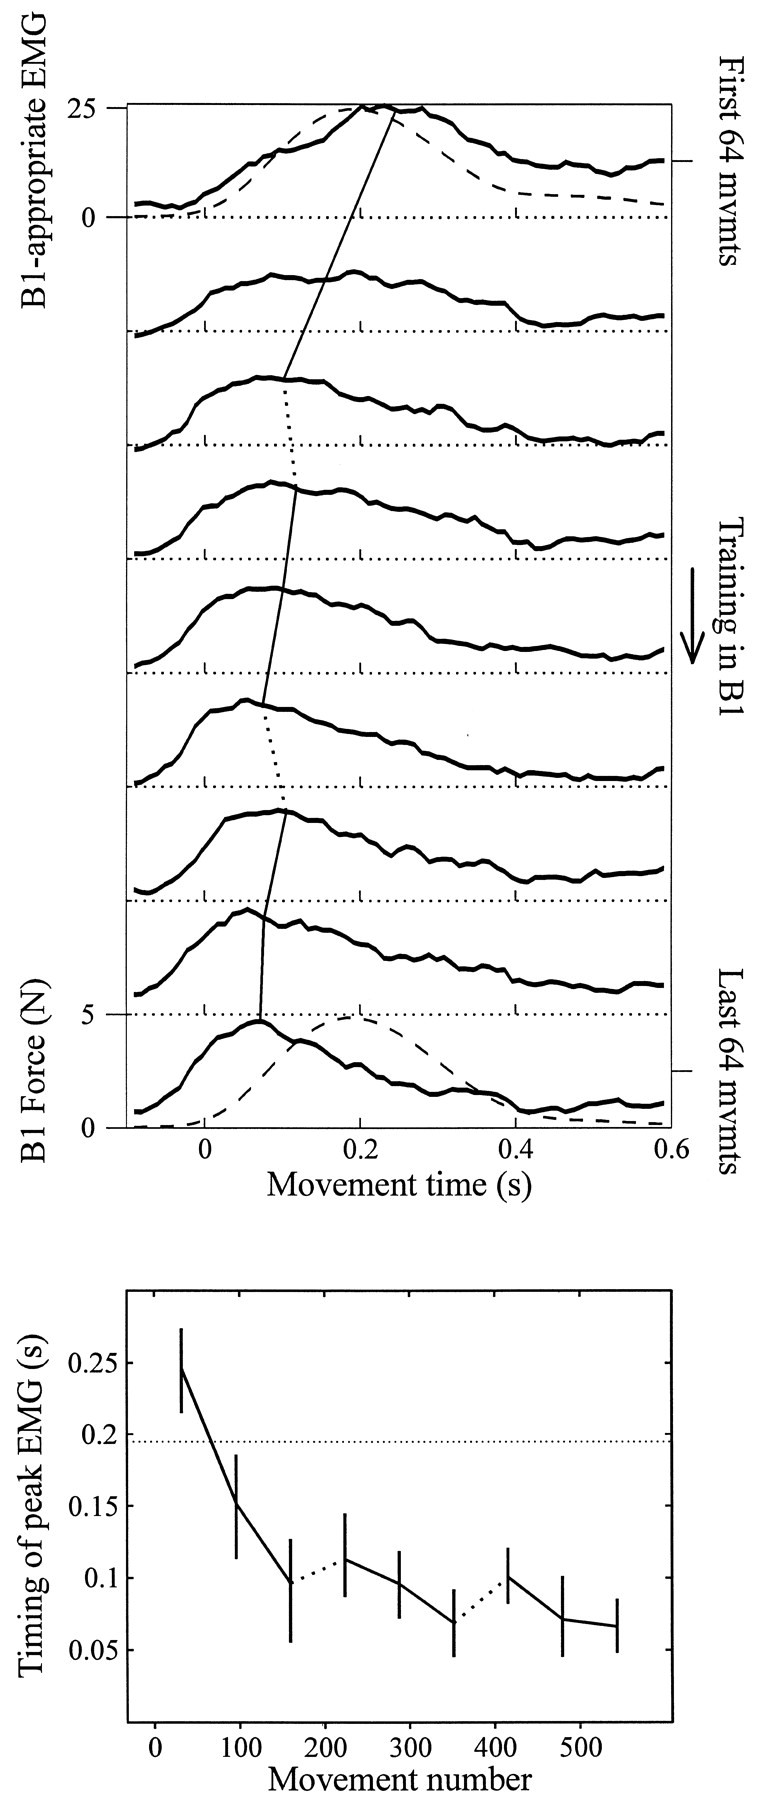
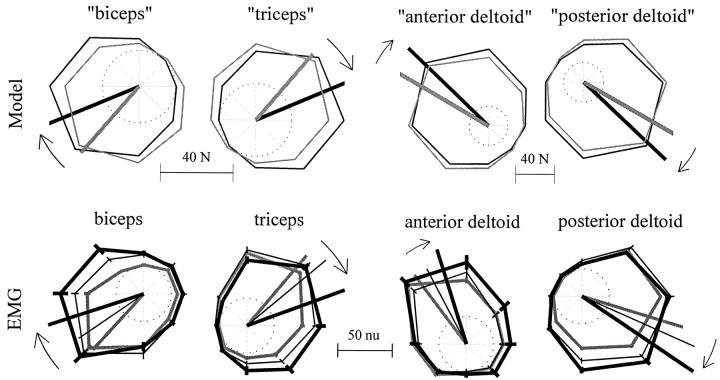
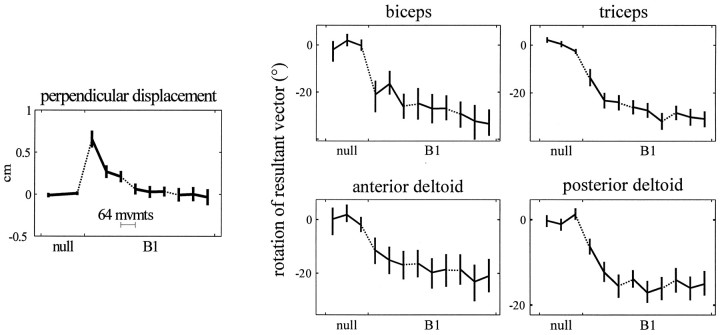
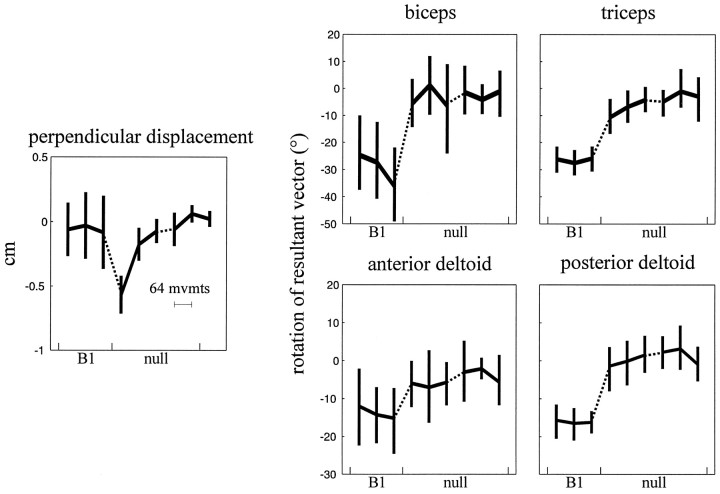
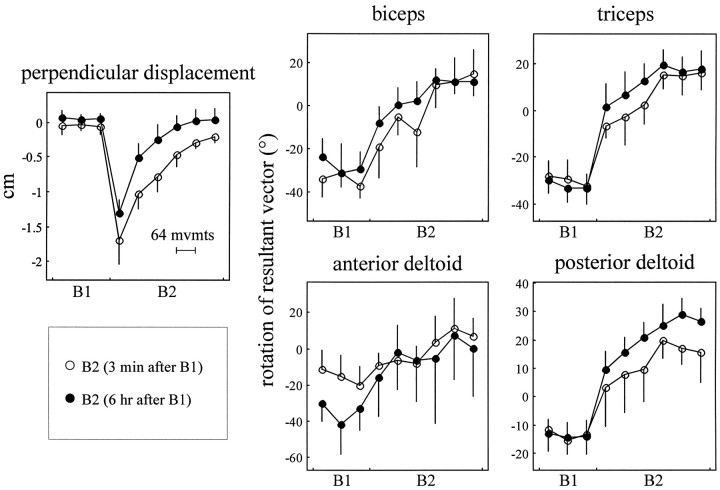
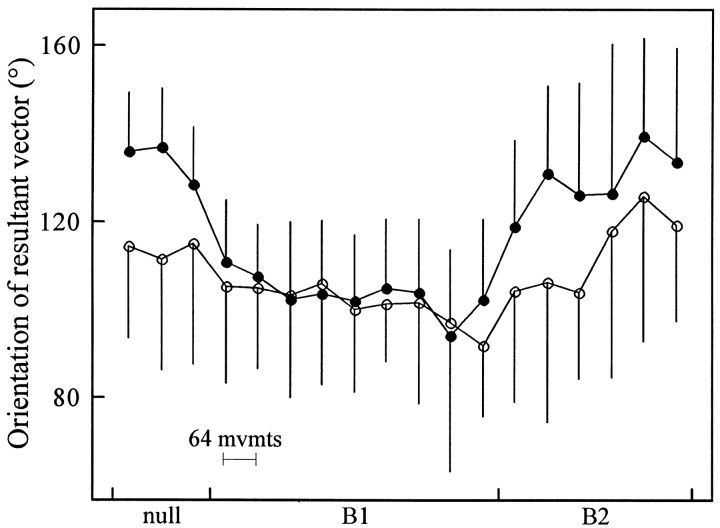
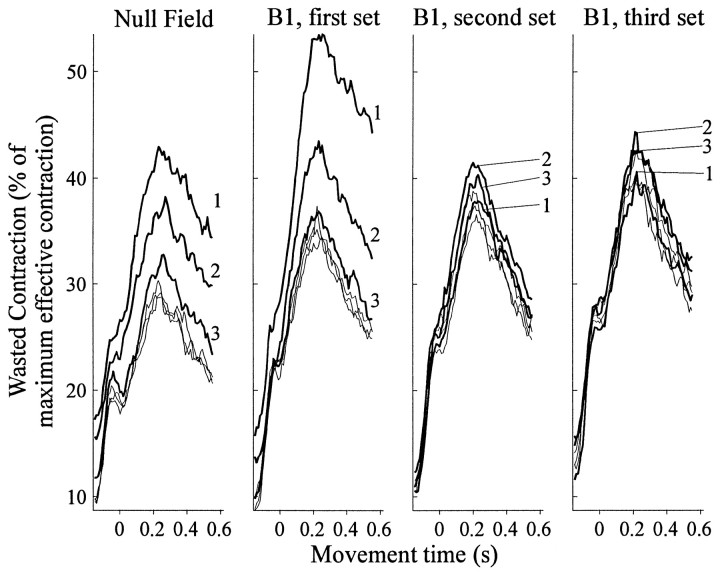
Theoretical and psychophysical studies have suggested that humans learn to make reaching movements in novel dynamic environments by building specific internal models (IMs). Here we have found electromyographic correlates of internal model formation. We recorded EMG from four muscles as subjects learned to move a manipulandum that created systematic forces (a "force field"). We also simulated a biomechanical controller, which generated movements based on an adaptive IM of the inverse dynamics of the human arm and the manipulandum. The simulation defined two metrics of muscle activation. The first metric measured the component of the EMG of each muscle that counteracted the force field. We found that early in training, the field-appropriate EMG was driven by an error feedback signal. As subjects practiced, the peak of the field-appropriate EMG shifted temporally to earlier in the movement, becoming a feedforward command. The gradual temporal shift suggests that the CNS may use the delayed error-feedback response, which was likely to have been generated through spinal reflex circuits, as a template to learn a predictive feedforward response. The second metric quantified formation of the IM through changes in the directional bias of each muscle's spatial EMG function, i.e., EMG as a function of movement direction. As subjects practiced, co-activation decreased, and the directional bias of each muscle's EMG function gradually rotated by an amount that was specific to the field being learned. This demonstrates that formation of an IM can be represented through rotations in the spatial tuning of muscle EMG functions. Combined with other recent work linking spatial tunings of EMG and motor cortical cells, these results suggest that rotations in motor cortical tuning functions could underlie representation of internal models in the CNS.


Figures

Fig. 1.
Fig. 1.
Experimental apparatus. Subjects make reaching movements while grasping a 2 df manipulandum (robotic arm). The manipulandum could be programmed to produce a force field.
Fig. 2.
Fig. 2.
Data used for building a simple force activation model for the anterior deltoid and data used for testing the validity of the model. We fitted the predicted muscle forces (as computed by an inertial model of the arm and best estimates of moment arms) to subjects’ mean EMG while moving in the null field during the agonist period (−50–100 msec into the movement) and during the antagonist period (200–300 msec into the movement; Eq. 7 fits a line to the change in activity between the agonist and antagonist periods). The simple muscle model, as derived by the data in the null field (top row), was validated by testing how well it predicted mean EMG patterns in the force field B1 after subjects had fully adapted to it. Top plots, The anterior deltoid force predicted by the inertial model is fitted to the mean EMG recorded from subjects during null field movements. Eachpoint is data for movement to a given direction. Eachcircle is the average normalized EMG recorded during that period in this muscle from all subjects. The line is the best linear fit (p < 0.001 for each figure), that represents the muscle model. Bottom plots, Validating the muscle model. The linear fit from the null field was used to transform the predicted forces necessary for movements in fieldB1 to EMG units. The x -axis is the predicted average EMG in anterior deltoid. The circles are the mean recorded EMG in all subjects after full adaptation. Thesolid line is the muscle model’s predictions. Thedotted line is the best possible linear fit of the validation data.
Fig. 3.
Fig. 3.
Hand paths and EMG recorded during movements.Left, Hand paths of a typical subject in her first and last (72nd) movements toward a target at 135° in the force fieldB1. The first movement is significantly perturbed from the straight line trajectory. With practice, movements become straight again. Dots are at 10 msec intervals. Thearrow indicates 250 msec into the movement. This is the position at which we measured perpendicular displacement from a straight line. Remaining plots, Processed EMG (normalized units) in the null field (all 24 movements toward 135°, gray line), during initial stages of training in the force field (first 8 movements toward 135°, thin black line), and late in training in the force field (last 8 movements, thick black line). Movement begins at t = 0. Each EMG trace represents data averaged across all 24 subjects. The vertical dotted lines delimit the 150 msec interval over which EMG is averaged to calculate the scalar variable am, representing time-averaged agonist burst EMG.
Fig. 4.
Fig. 4.
Perpendicular displacement (top) and subjects’ am (time-averaged agonist burst EMG) during movements toward 135°. Subjects completed one set of movements in the well learned null field environment and then three sets in the force field B1. Perpendicular displacement is measured 250 msec into the movement, averaged across directions and subjects; these data reflect change from average perpendicular displacement in null field movements. x -axis tick marks indicate breaks between sets of movements. Eachpoint includes data from eight movements (3 data points per set). Error bars reflect 95% confidence intervals of the mean.
Fig. 5.
Fig. 5.
Subjects’ composite EMG traces (solid lines) and forces (dotted lines). A, Thesolid line is the null field-appropriate EMG averaged over all subjects and all movements in the initial null field set (192 movements). The dotted line is the average force in the direction of the target actually produced during the same movements. B, The solid line is theB1-appropriate EMG trace, averaged over all subjects and over all movements during the final set of training in force field B1. The dotted line is the average force produced perpendicular to the direction of target during the same movements. Forces in both plots were calculated from subject trajectories, using the model structure outlined in Equations 3and 4. For the time series of EMG and force, maximum range of 95% confidence intervals of EMG and force were as follows: null field-appropriate EMG, ±5.3 units; parallel force, ±0.28 N;B1-appropriate EMG, ±6.2 units; perpendicular force, ±0.13 N.
Fig. 6.
Fig. 6.
The composite EMG trace appropriate for fieldB1 shifts with training. Top, Binned and averaged increase in the B1-appropriate EMG trace. Each trace is averaged over 64 movements and over all 24 subjects. The progression of plots from top tobottom shows EMG traces from early to late in training. Thedashed lines in the top and bottomaxes represent the magnitude of the force created by the viscous fieldB1, which remained consistent throughout training in B1. Although early in training the peak of the field-appropriate EMG lagged the imposed force, with training it preceded the imposed force. The timing of the peak was estimated by a fit to a fourth-order polynomial. The best estimate of the peak and its change with training is marked by the line that crosses the EMG traces from top to bottom. In thebottom figure, the timing of the peak of the EMG traces is plotted versus movement number. The dotted lines connecting data points represent the 3 min breaks between sets. Error bars reflect 95% confidence intervals of the mean (across all 24 subjects), as determined by bootstrapping. The dotted horizontal linerepresents the timing of the peak of the force created by the force field.
Fig. 7.
Fig. 7.
Rotations in muscle-tuning curves as predicted from a computational model that assumes adaptation of an IM and tuning curves as recorded from subjects’ EMG. Top, Movement-initiating muscle forces as predicted by the model for movements in the null field (gray) and inB1 (black). Polar plots display predicted movement-initiating force (fm) for each direction of movement. The radii of the scale circles (centered at the origin of each plot) are 20 N. The thick vector represents a tuning curve’s resultant vector (preferred direction). The model predicts that the resultant vector should rotate between the null field and B1. Thebars below each plot reveal the rescaling of the data (using Eq. 7 and the parameters in Table 2) into predicted muscle activations, in normalized units (nu) of EMG. Bottom, Tuning functions representing subjects’ movement initiating EMG (am) during training in null field (gray lines), early force field (thin black lines), and late force field (thick black lines).Thick lines are resultant vectors (preferred directions). The error bars around individual data points reflect 95% confidence intervals of the mean activation.
Fig. 8.
Fig. 8.
Left, Perpendicular displacement of the hand 250 msec into the movement, averaged across movement directions, during movements in null field and force field B1. Remaining plots, Rotation of am resultant vectors during movements in force field B1 with respect to null field. Each point contains data from 64 movements. Eachpoint is mean and 95% confidence interval (across subjects). Dotted lines represent 3 min breaks in training.
Fig. 9.
Fig. 9.
Perpendicular displacement of the hand and rotation of am resultant vectors in subjects who, after training in B1, trained in the null field 3 min later. Each point contains data from 64 movements. The first three data points are from the third set of movements in B1. Error bars reflect 95% confidence intervals of the mean (across subjects).
Fig. 10.
Fig. 10.
Perpendicular displacement and rotation of am resultant vectors in subjects who, after training in B1, trained inB2 3 minutes (○) or 6 hr (●) later. Eachpoint contains data from 64 movements. Error bars reflect 95% confidence intervals of the mean (across subjects). The first three data points are from the third set of movements inB1.
Fig. 11.
Fig. 11.
Orientations of anterior deltoid resultant vectors during training in the null field, B1, and B2. Whereas the previous Figures 8-10represent the rotation of am resultant vectors with respect to null field orientations, this figure represents the actual orientation during each stage of training. The symbols indicate the mean orientations in subjects who had a 3 min (○) or 6 hr (●) separation between B1 andB2. Error bars reflect 95% confidence intervals of the mean (across subjects).
Fig. 12.
Fig. 12.
Wasted contraction during movements in null field and B1. These plots show the wasted contraction (as a percent of effective contraction), averaged across subjects, as a function of time into each movement. Each line represents a bin of 32 movements. The leftmost plot contains traces from null field movements; the next three plots contain traces from the three sets of training in B1. Thenumbers inside the plot label the wasted contraction from the first, second, and third bins of movements in each set.

Similar articles

Cited by

References

    1. Atkeson CG. Learning arm kinematics and dynamics. Annu Rev Neurosci. 1989;12:157–183. - PubMed
    1. Barto AG, Fagg AH, Sitkoff N, Houk JC. A cerebellar model of timing and prediction in the control of reaching. Neural Comput. 1999;11:565–594. - PubMed
    1. Benda BJ, Gandolfo F, Li CSR, Tresch MC, DiLorenzo D, Bizzi E. Neuronal activities in M1 of a macaque monkey during reaching movements in a viscous force field. Soc Neurosci Abstr. 1997;23:1556.
    1. Bhushan N, Shadmehr R. Computational architecture of human adaptive control during learning of reaching movements in force fields. Biol Cybern. 1999;81:39–60. - PubMed
    1. Brashers-Krug T, Shadmehr R, Bizzi E. Consolidation in human motor memory. Nature. 1996;382:252–255. - PubMed

Publication types