. 1999 Oct;114(4):511-24.
doi: 10.1085/jgp.114.4.511.

Intrinsic cone adaptation modulates feedback efficiency from horizontal cells to cones

Affiliations

Intrinsic cone adaptation modulates feedback efficiency from horizontal cells to cones

I Fahrenfort et al. J Gen Physiol. 1999 Oct.

Abstract

Processing of visual stimuli by the retina changes strongly during light/dark adaptation. These changes are due to both local photoreceptor-based processes and to changes in the retinal network. The feedback pathway from horizontal cells to cones is known to be one of the pathways that is modulated strongly during adaptation. Although this phenomenon is well described, the mechanism for this change is poorly characterized. The aim of this paper is to describe the mechanism for the increase in efficiency of the feedback synapse from horizontal cells to cones. We show that a train of flashes can increase the feedback response from the horizontal cells, as measured in the cones, up to threefold. This process has a time constant of approximately 3 s and can be attributed to processes intrinsic to the cones. It does not require dopamine, is not the result of changes in the kinetics of the cone light response and is not due to changes in horizontal cells themselves. During a flash train, cones adapt to the mean light intensity, resulting in a slight (4 mV) depolarization of the cones. The time constant of this depolarization is approximately 3 s. We will show that at this depolarized membrane potential, a light-induced change of the cone membrane potential induces a larger change in the calcium current than in the unadapted condition. Furthermore, we will show that negative feedback from horizontal cells to cones can modulate the calcium current more efficiently at this depolarized cone membrane potential. The change in horizontal cell response properties during the train of flashes can be fully attributed to these changes in the synaptic efficiency. Since feedback has major consequences for the dynamic, spatial, and spectral processing, the described mechanism might be very important to optimize the retina for ambient light conditions.


Figures

Figure 1
Figure 1
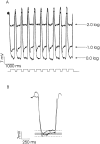
Voltage-clamp stimulation protocol, used to study changes in presynaptic calcium current during light-induced hyperpolarizations. The first trace shows a real light response (see inset) repeated nine times. In the second trace, a gradual depolarization of 4 mV during the first five steps, in 1-mV steps, is applied. For the third trace, a similar protocol as trace 1 was generated, but now all depolarizing steps are twice as large, yielding a total depolarization of 8 mV. The final amount of depolarization is indicated by the number to the right of the traces. After the flashes, a voltage protocol is made to study the tail currents, consisting of a 100-ms step to −7 mV, followed by a 1,500-ms step to −77 mV, after which it is stepped back to the resting membrane potential again. During the step to −77 mV, a 50-ms step to −87 mV is made to determine the leak conductance.
Figure 3
Figure 3
Changes in kinetics of HC light responses is independent of dopamine. (A) Overlay of the HC light responses to the first and last flash from 6-hydroxydopamine animals to the same flash train used in Fig. 2 A. Mean resting membrane potential was −34.6 ± 2.7 mV (± SEM; n = 8). In dopamine-depleted animals, changes in kinetics are still present. (B) Overlay of the HC light responses to the first and last flash measured in control retinas perfused with flupentixol, a D1, D2 antagonist. The changes in HC kinetics persist in a situation where dopamine actions are blocked. The gray area and the dashed lines have the same meaning as in Fig. 2.
Figure 2
Figure 2
Changes in kinetics of HC light responses. (A) HC light responses to 10 white, 500-ms full field flashes of −2.0, −1.0, and 0.0 log. Mean resting membrane potential was −34.72 ± 2.27 mV (± SEM; n = 10). Only the −1.0 log intensity responses are used in this study. There is a change in kinetics of HC light responses during the flash train. (B) An overlay of the first and last HC light response taken from A. The responses are shifted only along the horizontal axis. Timing and scaling are indicated. The gray area indicates the size of the secondary depolarization of the first flash and the area between the dashed lines indicates the size of the secondary depolarization of the last response.
Figure 4
Figure 4
Changes in cone light responses during the flash train. (A) Cone light responses to the same flash train that induces changes in kinetics of HC light responses. The transientness of the light response decreases and the sustained cone membrane potential depolarizes slightly. (B) Overlay of the first and last cone light response. The responses are only shifted along the horizontal axis. The gray area and the dashed lines have the same meaning as in Fig. 2.
Figure 5
Figure 5
Modulation of light-induced changes in presynaptic calcium current due to depolarization of the cone. A voltage protocol was constructed, depicted at the bottom of the figure, that mimics cone responses to the flash train. Measurements were done at cone resting membrane potential −42.5 ± 1.4 mV (± SEM; n = 15). The first trace shows the presynaptic currents due to such a protocol without depolarization of the cone (0 mV). The presynaptic currents stay unmodified. Second and third traces show presynaptic currents when cones are led to depolarize 4 and 8 mV, respectively. Values of the final depolarization level are indicated to the right of the current traces. There is an increase in “light-induced changes” of the presynaptic currents due to this depolarization. The increase is larger with larger depolarizations (8 mV).
Figure 6
Figure 6
Current–voltage relations of a cone to the voltage ramp protocol depicted at the bottom of the figure, in control condition (arrow 1), in the presence of 2 mM cobalt (arrow 2), and after washout (arrow 3). Cobalt shifts the ICa to more positive potentials.
Figure 7
Figure 7
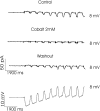
Cobalt blocks the light-induced presynaptic currents. The top current trace shows the voltage-dependent currents in control Ringer's solution to the part of the voltage protocol where the cone is let to depolarize 8 mV in 2-mV steps. The presence of 2 mM cobalt blocks the presynaptic currents (middle). After washout of cobalt, the presynaptic currents reappear. (Bottom) The synaptic current protocol is shown.
Figure 8
Figure 8
The relative position of the membrane potential to the activation function of the calcium current determines the light-induced modulation of the synaptic currents. (A) The modulation of the light-induced changes in presynaptic currents due to the stepwise depolarization of the cone (8 mV) are present in Co2+ when measured at depolarized levels. Clamping the cone at depolarized levels in the presence of cobalt makes the presynaptic currents reappear again. (Bottom) The voltage trace depicts the synaptic current protocol (8-mV trace) again. (B) Hyperpolarizing a cone to −87 mV blocks the presynaptic currents. The current trace is measured at a potential were ICa is not active. The increase in light-induced presynaptic currents due to the 8-mV depolarization is not present at these potentials.
Figure 9
Figure 9
Effect of niflumic acid on the depolarization-induced increase in presynaptic currents. (A) Tail current in control Ringer's solution (1) and in 100 μM niflumic acid (2). Niflumic acid blocks the tail currents showing that niflumic acid did indeed block IClCa. (B) Synaptic current protocol (8-mV trace) in control Ringer's solution and in the presence of 100 μM niflumic acid. The increase in presynaptic currents due to depolarization is still present in niflumic acid.
Figure 10
Figure 10
Changes in feedback signal from HC to cones during the flash train. Feedback-induced increases in ICa measured in cones using the same flash train that induces changes in the kinetics of HC responses. To measure feedback in a cone, the cone light response is saturated with a small spot (20-μm diameter). Feedback does not increase during the flash train.
Figure 11
Figure 11
Depolarization of the cone increases the effect of feedback on the increase of ICa. Cone were gradually depolarized during the first four flashes in 1-mV steps. In the beginning of the trace, the feedback-induced change in Ca current is small. Depolarization of the cone leads to an increase in the feedback-induced changes in ICa.
Figure 12
Figure 12
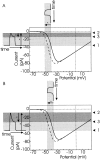
Light-induced changes in presynaptic calcium current. (A) Situation at the beginning of the flash train. A schematic drawing of a cone light response and the resulting HC response are indicated at the top and on the left, respectively. (1) The ICa at the resting membrane potential of the cone. This determines the resting membrane potential of the HCs. Light stimulation hyperpolarizes the cone (arrow A), which leads to a decrease in ICa (2), and thus to hyperpolarization of the HC (arrow B). This hyperpolarization induces a shift of the activation function of the calcium current in the cones (dotted line), leading to an increase in ICa (3). The effect of this increase in ICa can be seen in the HC light response as the secondary depolarization (arrow C). (B) Situation at the end of the flash train. In this condition, cones are depolarized 4 mV due to photoreceptor light adaptation. Due to this depolarization of the cone, the size of the secondary depolarization in the HC response (arrow C) has increased relative to the hyperpolarizing part of the HC response (arrow B).
Figure 13
Figure 13
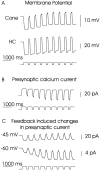
(A) Simulated cone and HC responses to the flash train. Cones rest at −46 mV and HCs at −32.2 mV in the dark. The horizontal cell response shows the characteristic increase of the secondary depolarization during this protocol. Cone adaptation is mimicked by a gradual depolarization of the cone by 4 mV during the first four flashes. (B) The changes in Ca current of the cone due to the flash stimulus protocol in the absence of feedback. (C) Increases in Ca current of the cone due to feedback from the HCs when the cone is clamped at −45 mV (top) and when the cone is initially clamped at −60 mV (bottom), and then gradually depolarized by 4 mV over the first five flashes. At −45 mV, the feedback-induced increase in the Ca current does not change, whereas gradual depolarization from −60 mV leads to a large increase in feedback-induced currents.

Similar articles

Cited by

References

    1. Akopian A., McReynolds J.S., Weiler R. Short-term potentiation of off-responses in turtle horizontal cells. Brain Res. 1991;546:132–138. - PubMed
    1. Barnes S., Deschenes M.C. Contribution of Ca and Ca-activated Cl channels to regenerative depolarization and membrane bistability of cone photoreceptors. J. Neurophysiol. 1992;68:745–755. - PubMed
    1. Baylor D.A., Hodgkin A.L. Changes in time scale and sensitivity in turtle photoreceptors. J. Physiol. 1974;242:729–758. - PMC - PubMed
    1. Burkhardt D.A. Light adaptation and photopigment bleaching in cone photoreceptors in situ in the retina of the turtle. J. Neurosci. 1994;14:1091–1105. - PMC - PubMed
    1. Dong C.J., Werblin F.S. Dopamine modulation of GABAc receptor function in an isolated retinal neuron. J. Neurophysiol. 1994;71:1258–1260. - PubMed

Publication types