. 1999 Sep 20;190(6):851-60.
doi: 10.1084/jem.190.6.851.

A member of the dendritic cell family that enters B cell follicles and stimulates primary antibody responses identified by a mannose receptor fusion protein

Affiliations

A member of the dendritic cell family that enters B cell follicles and stimulates primary antibody responses identified by a mannose receptor fusion protein

C Berney et al. J Exp Med. .

Abstract

Dendritic cells (DCs) are known to activate naive T cells to become effective helper cells. In addition, recent evidence suggests that DCs may influence naive B cells during the initial priming of antibody responses. In this study, using three-color confocal microscopy and three-dimensional immunohistograms, we have observed that in the first few days after a primary immunization, cells with dendritic morphology progressively localize within primary B cell follicles. These cells were identified by their ability to bind a fusion protein consisting of the terminal cysteine-rich portion of the mouse mannose receptor and the Fc portion of human immunoglobulin (Ig)G1 (CR-Fc). In situ, these CR-Fc binding cells express major histocompatibility complex class II, sialoadhesin, and CD11c and are negative for other markers identifying the myeloid DC lineage, such as (CD11b), macrophages (F4/80), follicular DCs (FDC-M2), B cells (B220), and T cells (CD4). Using CR-Fc binding capacity and flow cytometry, the cells were purified from the draining lymph nodes of mice 24 h after immunization. When injected into naive mice, these cells were able to prime T cells as well as induce production of antigen-specific IgM and IgG1. Furthermore, they produced significantly more of the lymphocyte chemoattractant, macrophage inflammatory protein (MIP)-1alpha, than isolated interdigitating cells. Taken together, these results provide evidence that a subset of DCs enters primary follicles, armed with the capacity to attract and provide antigenic stimulation for T and B lymphocytes.


Figures
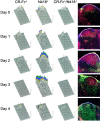
Figure 1
Figure 1
Localization of CR-Fc binding cells in lymph nodes with time after a primary immunization. Three-color confocal analysis was used in order to determine when and where CR-Fc binding cells appeared in the tissue. Cryostat sections prepared from murine lymph nodes obtained at days 0–4 (A–E) of a primary response were processed for IgM expression (red), N418 labeling (green), and CR-Fc binding (blue). The images were then digitally transformed using a computer program in order to map the MFI (in arbitrary units) for either single (CR-Fc+; N418+) or double (CR-Fc+/ N418+) positive cells. The resulting 3D immunohistograms revealed that CR-Fc binding cells accumulated with time in the outer part of the B cell follicles. Many of these cells were also N418+ (see the CR-Fc+/N418+ column). The scale 0–250 represents the MFI, with the colors yellow, blue, green, and red representing values in the 100–150, 150–200, 200–250, and >250 range, respectively.
Figure 3
Figure 3
Profile of CR-Fc binding cells by flow cytometry. 24 h after a primary immunization, low buoyant density cells were labeled for CR-Fc binding and N418 expression. Setting a gate (R1) using the scatter parameters demonstrated that all N418+ cells (gray) produced an elevated side scatter pattern. The N418 single positive cells represented 50% of the total low density population while 10% were N418/CR-Fc double positive.
Figure 2
Figure 2
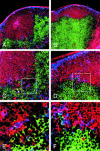
B cells, T cells, and CR-Fc binding cells colocalize in the outer B cell follicles. Cryostat sections prepared from murine lymph nodes obtained at day 3 (A, C, and E) and day 4 (B, D, and F) of a primary response were processed for IgM expression (red), CD4 labeling (green), and CR-Fc binding (blue). Especially at the higher magnification (E and F) of the areas outlined in C and D, CR-Fc binding cells (blue) and T cells (green) can be observed within the B cell follicles (red).
Figure 5
Figure 5
OVA-specific antibody titers in B cell supernatants from the lymph nodes of mice receiving CR-Fc binding versus nonbinding or no cells. CR-Fc binding and nonbinding cells were isolated from OVA-immune mice, then injected subcutaneously into naive mice. 7 d later, the B cells were isolated from the lymph nodes on the side receiving CR-Fc binding (black bars) or nonbinding (stippled bars) cells. In addition, B cells from lymph nodes draining sites where no cells were injected were also evaluated (white bars). The B cells were cultured for 7 d, and then the supernatants were subjected to ELISA to determine the level of isotype-specific anti-OVA titers. The data are presented as the maximum dilution at which a titer was still observed. These data are representative of five experiments.
Figure 4
Figure 4
T cell priming by CR-Fc binding cells. (A) CR-Fc binding cells were isolated from OVA-immune mice, then injected subcutaneously into naive mice. 7 d later, the T cells were isolated from the lymph nodes on the side receiving the injection and compared with T cells isolated from nondraining lymph nodes for in vitro restimulation. In the presence of splenic antigen-presenting cells, both T cell populations were incubated without (−) or with (+) OVA. At 24 h, [3H]thymidine was added, and 24 h later, incorporation was assessed. (B) CR-Fc binding cells were isolated from immune mice and then incubated at varying concentrations with 105 OVA-specific transgenic T cells. At 24 h, [3H]thymidine was added, and 24 h later, incorporation was assessed. Both sets of data are representative of three experiments.
Figure 4
Figure 4
T cell priming by CR-Fc binding cells. (A) CR-Fc binding cells were isolated from OVA-immune mice, then injected subcutaneously into naive mice. 7 d later, the T cells were isolated from the lymph nodes on the side receiving the injection and compared with T cells isolated from nondraining lymph nodes for in vitro restimulation. In the presence of splenic antigen-presenting cells, both T cell populations were incubated without (−) or with (+) OVA. At 24 h, [3H]thymidine was added, and 24 h later, incorporation was assessed. (B) CR-Fc binding cells were isolated from immune mice and then incubated at varying concentrations with 105 OVA-specific transgenic T cells. At 24 h, [3H]thymidine was added, and 24 h later, incorporation was assessed. Both sets of data are representative of three experiments.
Figure 7
Figure 7
Cell surface molecules expressed by isolated CR-Fc binding cells. CR-Fc binding cells were isolated 24 h after OVA injection. The cells were then double labeled for CR-Fc plus one of the markers indicated. The fine line represents the level of fluorescence of CR-Fc binding cells with a control antibody, and the bold line represents the level of expression on CR-Fc binding cells of the specific marker.
Figure 6
Figure 6
OVA-specific serum titers of mice receiving CR-Fc binding cells. CR-Fc binding cells were isolated from OVA-immune mice, then adoptively transferred subcutaneously into naive mice (105 per mouse). 14 d later, the same mice were injected subcutaneously a second time with a freshly isolated preparation of CR-Fc binding cells from OVA-immune mice (5 × 10⁴ per mouse). Serum was obtained before the primary (D0) and secondary (D14) injections. Isotype-specific anti-OVA titers were assessed by ELISA. Each data point represents the maximum dilution at which a titer was still observed for an individual mouse.
Figure 8
Figure 8
Chemokine production by the different subsets of DC. Day 6 BM-DCs, CR-Fc binding cells (CR-Fc+/N418+; isolated 24 h after OVA injection), and interdigitating cells (CR-Fc/N418+; isolated 24 h after OVA injection) were isolated and cultured for 24 h in medium. Supernatants were then harvested, and the levels of MIP-1α and RANTES were determined by ELISA.

References

    1. Steinman R.M., Pack M., Inaba K. Dendritic cells in the T cell areas of lymphoid organs. Immunol. Rev. 1997;156:25–38. - PubMed
    1. Banchereau J., Steinman R.M. Dendritic cells and the control of immunity. Nature. 1998;392:245–252. - PubMed
    1. Caux C., Massacrier C., Vanbervliet B., Dubois B., Van Kooten C., Durand I., Banchereau J. Activation of human dendritic cells through CD40 cross-linking. J. Exp. Med. 1994;180:1263–1272. - PMC - PubMed
    1. Cella M., Scheidegger D., Palmer-Lehmann K., Lane P., Lanzavecchia A., Alber G. Ligation of CD40 on dendritic cells triggers production of high levels of interleukin-12 and enhances T cell stimulatory capacityT–T help via APC activation. J. Exp. Med. 1996;184:747–752. - PMC - PubMed
    1. Koch F., Stanzl U., Jennewein P., Janke K., Heufler C., Kampgen E., Romani N., Schuler G. High level IL-12 production by murine dendritic cellsupregulation via MHC class II and CD40 molecules and downregulation by IL-4 and IL-10. J. Exp. Med. 1996;184:741–746. - PMC - PubMed

MeSH terms