. 1999 Sep 28;96(20):11122-7.
doi: 10.1073/pnas.96.20.11122.

Ligand-receptor binding measured by laser-scanning imaging

Affiliations

Ligand-receptor binding measured by laser-scanning imaging

P Zuck et al. Proc Natl Acad Sci U S A. .

Abstract

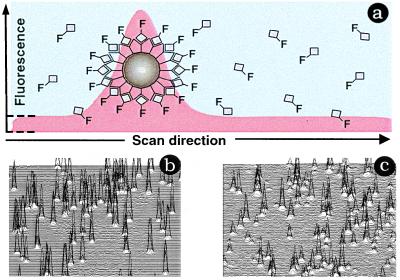
This report describes the integration of laser-scanning fluorometric cytometry and nonseparation ligand-binding techniques to provide new assay methods adaptable to miniaturization and high-throughput screening. Receptor-bound, cyanine dye-labeled ligands, [Cy]ligands, were discriminated from those free in solution by measuring the accumulated fluorescence associated with a receptor-containing particle. To illustrate the various binding formats accommodated by this technique, saturation- and competition-binding analyses were performed with [Cy]ligands and their cognate receptors expressed in CHO cells or as fusion proteins coated on polystyrene microspheres. We have successfully applied this technique to the analysis of G protein-coupled receptors, cytokine receptors, and SH2 domains. Multiparameter readouts from ligands labeled separately with Cy5 and Cy5.5 demonstrate the simultaneous analysis of two target receptors in a single well. In addition, laser-scanning cytometry has been used to assay enzymes such as phosphatases and in the development of single-step fluorescent immunoassays.


Figures

Figure 1
Figure 1
(a) Cross-section fluorescence scan of a labeled bead or cell. As the laser beam moves into the sample, bulk or free fluorescent ligand is measured (red area bracketed by dotted line). Above this plateau is the fluorescence associated with particle-bound ligand. Measurement of bound and free ligand thus is accomplished simultaneously, achieving the “separation” required for a receptor-binding assay using optical methods. (b) Raster scans from mm2 sectors of a single well of a 96-well microtiter plate. Shown is a scan from a well containing Cy5-labeled ligand associated with 6-μm beads (b) or cells (c).
Figure 2
Figure 2
Evaluation of binding parameters for GPCR and cytokine receptors by LSI. (a) Saturation binding of CXCR2 expressed on CHO cells with [Cy5]IL8S72C, KD = 0.91 ± 0.45 nM. (Inset) Competition of [Cy5]IL8S72C by IL-8 (○), growth-related cytokine α (●), PS76292 (♦), or RANTES (⋄). [[Cy5]IL8S72C] = 1 nM; Ki(IL-8) = 1.2 ± 0.42 nM; Ki(growth-related cytokine α) = 2.5 ± 0.8 nM, Ki(PS76292) = 101 ± 2 nM. (b) Saturation binding of bead-immobilized IL6Rα-Fc with [Cy5]IL-6, KD= 3.4 ± 1.5 nM. (Inset) Competition of [Cy5]IL-6 by IL-6 (●) and leptin (○). [[Cy5]IL-6] = 5 nM; Ki (IL-6) = 4.1 ± 3.4 nM.] (c) Saturation binding of bead-immobilized ObR-Fc with [Cy5]leptin, KD= 0.5 ± 0.6 nM. (Inset) Competition of [Cy5]leptin by leptin (●) and IL-6 (○). [[Cy5]leptin] = 2.5 nM; Ki (leptin) = 0.42 ± 0.14 nM.] (d) Dissociation of [Cy5]leptin from bead-immobilized ObR-Fc, t1/2 = 35 min. (Inset) Reversibility of ObR-Fc and IL6Rα-Fc receptor ligand complexes; signal from R⋅L complex at equilibrium (open bars) and after addition of 10 μM cytokine (solid bars). All data shown represent averages of three to five experiments.
Figure 3
Figure 3
Receptor multiplex assays. (Left) Different receptors on common particles. Cy5.5+ and Cy5+ (a), Cy5.5+, (b) or Cy5+ (c) fluorescence events detected for indicated labeled ligands bound to ObR-Fc and IL6Rα-Fc on common beads (solid bars) and in the presence of 10 μM unlabeled IL-6 (hatched bars). (Right) Different receptors on different particles. Cy5.5+ (d) or Cy5+ (e) fluorescence events detected for indicated labeled ligands bound to ObR-Fc and IL6Rα-Fc on separate beads (solid bars) and in the presence of 10 μM unlabeled IL-6 (hatched bars).
Figure 4
Figure 4
Phosphopeptide–SH2 domain interactions. (a) Displacement of [Cy5]pY-IRS1893–899 from Grb2 by consensus (circles) and nonconsensus (diamonds) phosphopeptides; pY-IRS1893–899 (○); pY-Shc310–324 (●); pY-ObR981–992 (⋄); pY-EpoR450–461(♦); and phenylphosphate (■). [Cy5]pY-IRS1893–899 = 15 nM. (b) Avidity effects. [Cy5]pY-IRS1893–899 (20 nM) displacement from bead-tethered GST-Grb2 with excess pY-IRS1893–899 (60 μM) (solid bars). [Cy5]GST-Grb2 (3 nM; open bars) displacement from bead-tethered pY-IRS1893–899 by excess GST-Grb2 (1 μM).
Figure 5
Figure 5
Phosphatase assay. (a) Schematic of unmasking assay. (b) PhospoFLAG peptide-coated microspheres incubated with YOP or without YOP. Phosphotyrosine (solid bars) and FLAG peptide (open bars) were detected with [Cy5]antiphosphotyrosine and [Cy5]anti-FLAG, respectively. (c) Time course of dephosphorylation. Various concentrations of YOP, 0 nM (♦), 1.5 nM (▾), 3 nM (▴), 6 nM (■), or 25 nM (●), were incubated with phosphoFLAG peptide-coated microspheres in the presence of [Cy5]anti-FLAG and scanned repeatedly at the indicated time intervals.

References

    1. Debouck C, Goodfellow P N. Nat Genet. 1999;21:48–50. - PubMed
    1. Chabala J C. In: Comb. Chem. Mol. Diversity Drug Discovery. Gordon E M, Kerwin J F Jr, editors. New York: Wiley–Liss; 1998. pp. 3–15.
    1. Hart H E, Greenwald E B. Mol Immunol. 1979;16:265–267. - PubMed
    1. Hemmila I, Webb S. Drug Discovery Today. 1997;2:373–381.
    1. Tsien R Y, Bacskai B J, Adams S R. Trends Cell Biol. 1993;3:242–245. - PubMed

LinkOut - more resources