

A theoretical search for folding/unfolding nuclei in three-dimensional protein structures
- PMID: 10500171
- PMCID: PMC18028
- DOI: 10.1073/pnas.96.20.11299
A theoretical search for folding/unfolding nuclei in three-dimensional protein structures
Abstract
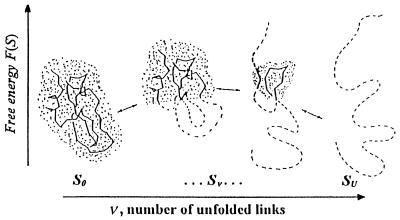
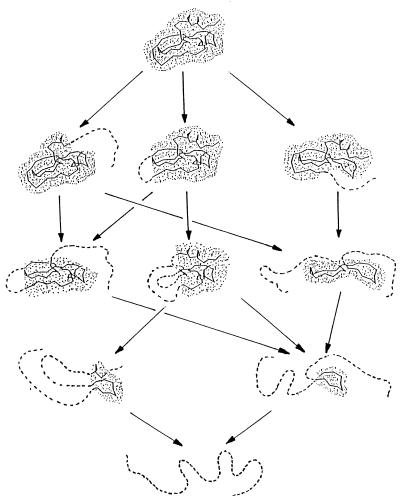
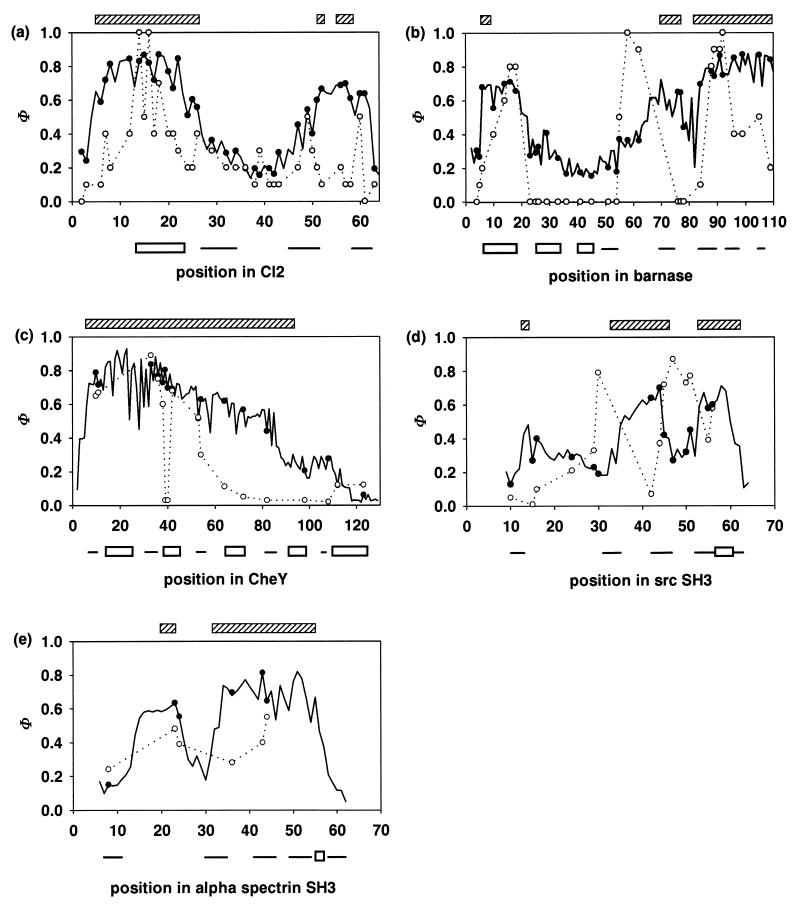
When a protein folds or unfolds, it has to pass through many half-folded microstates. Only a few of them can be seen experimentally. In a two-state transition proceeding with no accumulation of metastable intermediates [Fersht, A. R. (1995) Curr. Opin. Struct. Biol. 5, 79-84], only the semifolded microstates corresponding to the transition state can be outlined; they influence the folding/unfolding kinetics. Our aim is to calculate them, provided the three-dimensional protein structure is given. The presented approach follows from the capillarity theory of protein folding and unfolding [Wolynes, P. G. (1997) Proc. Natl. Acad. Sci. USA 94, 6170-6175]. The approach is based on a search for free-energy saddle point(s) on a network of protein unfolding pathways. Under some approximations, this search is rapidly performed by dynamic programming and, despite its relative simplicity, gives a good correlation with experiment. The computed folding nuclei look like ensembles of those compact and closely packed parts of the three-dimensional native folds that contain a small number of disordered protruding loops. Their estimated free energy is consistent with the rapid (within seconds) folding and unfolding of small proteins at the point of thermodynamic equilibrium between the native fold and the coil.
Figures
Comment in
-
Go-ing for the prediction of protein folding mechanisms.Proc Natl Acad Sci U S A. 1999 Oct 12;96(21):11698-700. doi: 10.1073/pnas.96.21.11698. Proc Natl Acad Sci U S A. 1999. PMID: 10518512 Free PMC article. Review. No abstract available.
References
-
- Fersht A R. Curr Opin Struct Biol. 1995;5:79–84. - PubMed
-
- Fersht A R. Curr Opin Struct Biol. 1997;7:3–9. - PubMed
-
- Jackson S E. Fold Des (London) 1998;3:R81–R91. - PubMed
-
- Dobson C M, Karplus M. Curr Opin Struct Biol. 1999;9:92–101. - PubMed
-
- Matouscheck A, Kellis J T, Jr, Serrano L, Bycroft M, Fersht A R. Nature (London) 1990;346:440–445. - PubMed
Publication types
MeSH terms
LinkOut - more resources
Full Text Sources
