. 1999 Sep 28;96(20):11305-10.
doi: 10.1073/pnas.96.20.11305.

Prediction of protein-folding mechanisms from free-energy landscapes derived from native structures

Affiliations

Prediction of protein-folding mechanisms from free-energy landscapes derived from native structures

E Alm et al. Proc Natl Acad Sci U S A. .

Abstract

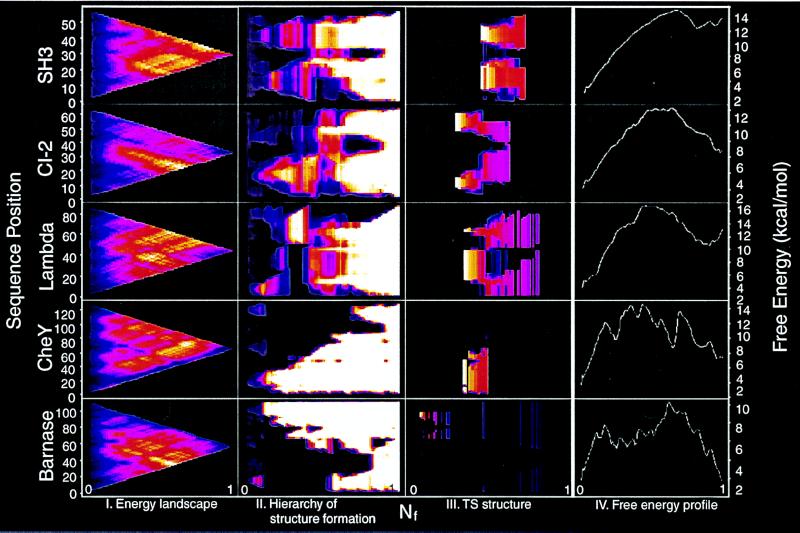
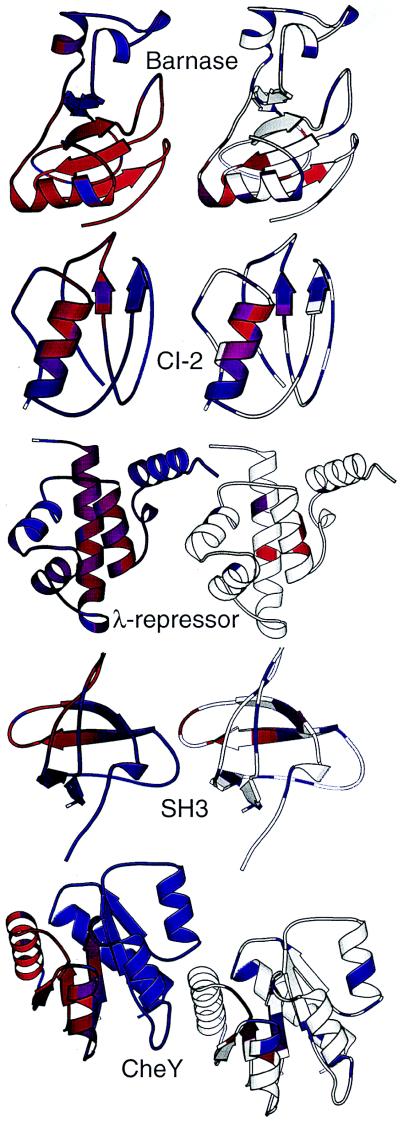
Guided by recent experimental results suggesting that protein-folding rates and mechanisms are determined largely by native-state topology, we develop a simple model for protein folding free-energy landscapes based on native-state structures. The configurations considered by the model contain one or two contiguous stretches of residues ordered as in the native structure with all other residues completely disordered; the free energy of each configuration is the difference between the entropic cost of ordering the residues, which depends on the total number of residues ordered and the length of the loop between the two ordered segments, and the favorable attractive interactions, which are taken to be proportional to the total surface area buried by the ordered residues in the native structure. Folding kinetics are modeled by allowing only one residue to become ordered/disordered at a time, and a rigorous and exact method is used to identify free-energy maxima on the lowest free-energy paths connecting the fully disordered and fully ordered configurations. The distribution of structure in these free-energy maxima, which comprise the transition-state ensemble in the model, are reasonably consistent with experimental data on the folding transition state for five of seven proteins studied. Thus, the model appears to capture, at least in part, the basic physics underlying protein folding and the aspects of native-state topology that determine protein-folding mechanisms.


Figures

Figure 1
Figure 1
Column I (free-energy landscape in the contiguous sequence model). Free-energy landscapes in the contiguous sequence model for the SH3 domain (row 1), CI-2 (row 2), barnase (row 3), Che Y (row 4), and λ repressor (row 5). In the contiguous sequence model, each configuration consists of a single stretch of ordered residues. Thus, each of the configurations on the free-energy landscape can be uniquely identified by two parameters, namely the length of the stretch of ordered residues or, equivalently, the fraction of residues ordered, Nf (x axis) and the location of the center of the ordered segment (y axis). Colors indicate free energy and are computed from Eq. 1 (without the loop entropy term); black indicates 0 kcal/mol, and white indicates 30 kcal/mol for SH3, 25 kcal/mol for CI-2 and λ repressor, 35 kcal/mol for Che Y, and 40 kcal/mol for barnase. The color scheme used to represent free energies between 0 kcal/mol and the upper bounds is black–blue (0–25% of upper bound), blue–magenta (25–50%), magenta–red (50–75%), red–yellow (75–88%) and yellow–white (88–100%). Column II (hierarchy of structure formation). The frequencies with which individual residues were ordered in a Boltzmann weighted ensemble of the configurations available under the sequential binary collision model are shown for each value of Nf (see text); the y axis is position along the sequence. Colors indicate the frequencies with which residues were ordered (black–blue, 0.–0.25; blue–magenta, 0.25–0.50; magenta–red, 0.50–.75; red–yellow, 0.75–0.88; and yellow–white, 0.88–1.00). Column III (structure in the transition-state ensemble). The number of times each residue was ordered in the top 100 transition states is shown as a function of Nf; the color scheme (with counts taking the place of frequencies) and axes are as in Column II. Column IV (free energy profile). The free energy, as a function of Nf, was computed from the partition function for each value of Nf as described in the text. The x axis is the reaction coordinate, Nf, and the y axis is the free energy in kcal/mol.
Figure 2
Figure 2
Distribution of thermally accessible states. Y(Nf) = Σi(Pi2), which represents the inverse number of thermally accessible states available to the system, was computed for all values of Nf, and the result for SH3 and γ repressor is shown. The sharp peak near Nf ∼ 0.8 for the SH3 domain (solid line) indicates a drastic reduction in the number of accessible states late in folding that is also seen for CI-2, barnase, and Che Y. By contrast, λ-repressor (dotted line) does not exhibit such a drastic reduction in accessible states, suggesting a more plastic folding mechanism.
Figure 3
Figure 3
Comparison of computed and experimental φ values. (Left) Protein structures are shown colored by φ-values computed directly from the sequential binary collision model. Red indicates residues that are important in stabilizing the folding transition state (high φ-values), and blue indicates residues that do not stabilize the transition state. (Right) Structures colored by experimentally observed φ-values; residues with a phi-value of 0 are colored blue, residues with a φ-value of 1 are colored red; purple shades indicate residues with intermediate φ-values, and white regions indicate residues for which there are no experimental data.

Comment in

References

    1. Alm E, Baker D. Curr Opin Struct Biol. 1999;9:189–196. - PubMed
    1. Kim D E, Baker D. Proc Natl Acad Sci USA. 1998;95:4982–4986. - PMC - PubMed
    1. Riddle D S, Santiago J V, Bray-Hall S T, Doshi N, Grantcharova V P, Yi Q, Baker D. Nat Struct Biol. 1997;4:805–809. - PubMed
    1. Perl D, Welker C, Schindler T, Schroder K, Marahiel M A, Jaenicke R, Schmid F X. Nat Struct Biol. 1998;5:229–235. - PubMed
    1. Grantcharova V P, Riddle D S, Santiago J V, Baker D. Nat Struct Biol. 1998;5:714–720. - PubMed

Publication types

LinkOut - more resources