. 1999 Sep 28;96(20):11387-92.
doi: 10.1073/pnas.96.20.11387.

Ecosystem rooting depth determined with caves and DNA

Affiliations

Ecosystem rooting depth determined with caves and DNA

R B Jackson et al. Proc Natl Acad Sci U S A. .

Abstract

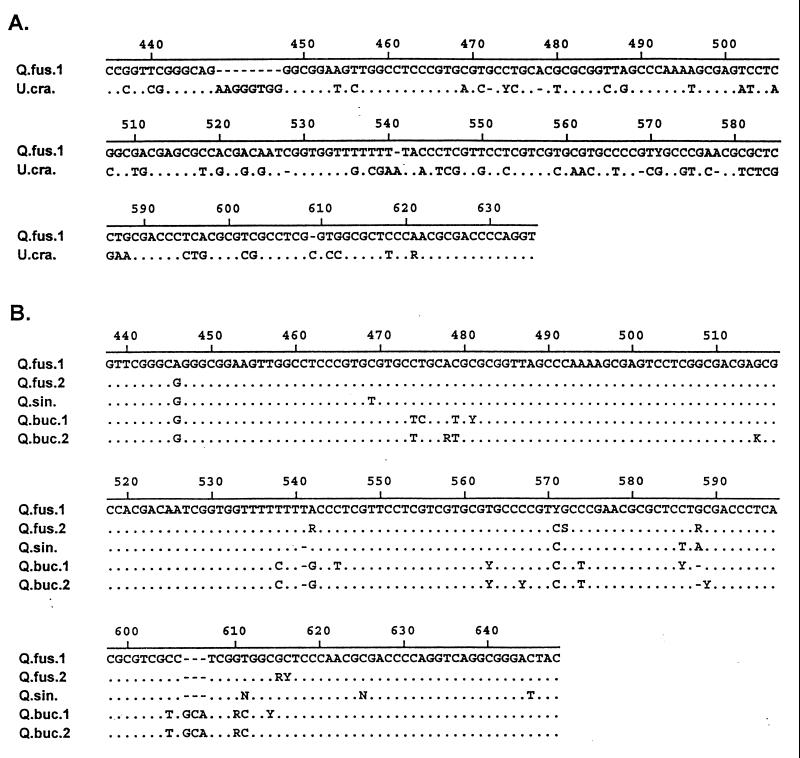
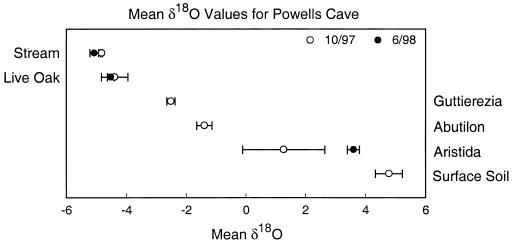
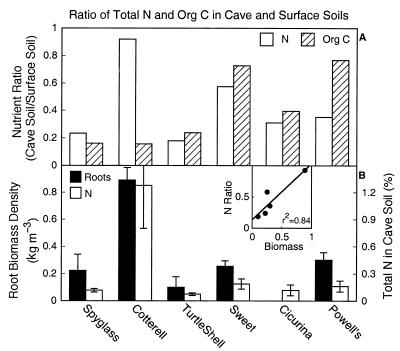
Belowground vertical community composition and maximum rooting depth of the Edwards Plateau of central Texas were determined by using DNA sequence variation to identify roots from caves 5-65 m deep. Roots from caves were identified by comparing their DNA sequences for the internal transcribed spacer (ITS) region of the 18S-26S ribosomal DNA repeat against a reference ITS database developed for woody plants of the region. Sequencing the ITS provides, to our knowledge, the first universal method for identifying plant roots. At least six tree species in the system grew roots deeper than 5 m, but only the evergreen oak, Quercus fusiformis, was found below 10 m. The maximum rooting depth for the ecosystem was approximately 25 m. (18)O isotopic signatures for stem water of Q. fusiformis confirmed water uptake from 18 m underground. The availability of resources at depth, coupled with small surface pools of water and nutrients, may explain the occurrence of deep roots in this and other systems.


Figures

Figure 1
Figure 1
Alignments of reference ITS sequences illustrating the ability to distinguish between genera (A) and species within a genus (B). (A and B) For both alignments, the top sequence is used as a reference for the sequences below it. Agreement with the reference sequence is indicated by a period, and differences are indicated by a nucleotide symbol. Gaps introduced to improve the alignment are indicated by dashes. Standard International Union of Biochemistry nucleotide symbols are used: A = adenosine, G = guanosine, C = cytidine, T = thymidine, R = purine (A or G), Y = pyrimidine (C or T), S = G or C, W = A or T, K = G or T, M = A or C, and N = any nucleotide (unreadable). All polymorphisms were confirmed on both strands. (A) Alignment of a portion of the ITS sequences for Q. fusiformis and U. crassifolia, the two most closely related genera in the reference database. All other intergeneric alignments showed even less similarity. (B) Alignment of three oak species: Q. fusiformis, Q. sinuata, and Quercus buckleyi. Note that there are two representatives for Q. fusiformis and Q. buckleyi. Although there are fewer diagnostic characteristics within the oaks, they can be distinguished readily by consistent differences across the ITS region (Q. fusiformis and Q. sinuata are the two most difficult species we distinguish). Vegetation surveys at the surface of each cave also constrain the species potentially found in each cave (and act as a check on the ITS results).
Figure 2
Figure 2
Comparison of 18O isotopic signatures on two dates for stem water of plants at the surface of the Powell’s Cave site with the signatures of water from surface soil (surface to bedrock) and from an 18-m-deep underground stream (mean ± SEM; n = 2–5). The species sampled were Abutilon fructicosum (a forb), Aristida purpurea (a grass), Guttierezia dracunculoides (a subshrub), and Q. fusiformis Small (live oak tree), and the two sampling dates were October 25, 1997 and June 27, 1998 (the cave is open only on the last weekends of February, June, and October). Isotopic analyses were run at the Stable Isotope Research Facility of the University of Utah. Water in the stems of live oaks at the surface had an 18O signature that closely matched the underground stream water, evidence that the trees are likely using this water as a primary source.
Figure 3
Figure 3
(A) The ratio of total N and C concentrations of cave soils relative to surface soils at six cave sites. (B) Root biomass density (kg m−3) and total N (%) in cave soil. The caves are arranged in order of increasing depth from left to right; see Table 1 for the location and depth of each cave. (Inset) The relationship between root biomass density in cave soils and the proportion of total N in cave soil relative to surface soil (r2 = 0.84; P = 0.03).

References

    1. Nepstad D C, de Carvalho C R, Davidson E A, Jipp P H, Lefebvre P A, Negreiros G H, da Silva E D, Stone T A, Trumbore S E, Vieira S. Nature (London) 1994;372:666–669.
    1. Brimhall G H, Chadwick O A, Lewis C J, Compston W, Williams I S, Danti K J, Dietrich W E, Power M E, Hendricks D, Brah J. Science. 1991;255:695–702. - PubMed
    1. Fisher M J, Rao I M, Ayarza M A, Lascano C E, Sanz J I, Thomas R J, Vera R R. Nature (London) 1994;371:236–238.
    1. Greenwood E A N. Adv Bioclimatol. 1992;1:89–154.
    1. Jackson R B, Mooney H A, Schulze E-D. Proc Natl Acad Sci USA. 1997;94:7362–7366. - PMC - PubMed

Publication types

Associated data

LinkOut - more resources