

The effect of N-terminal acetylation and the inhibition activity of acetylated enkephalins on the aminopeptidase M-catalyzed hydrolysis of enkephalins
- PMID: 10503775
- PMCID: PMC7124199
- DOI: 10.1016/s0196-9781(99)00089-3
The effect of N-terminal acetylation and the inhibition activity of acetylated enkephalins on the aminopeptidase M-catalyzed hydrolysis of enkephalins
Abstract
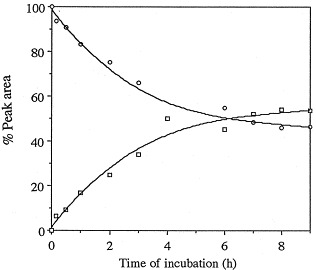
High performance liquid chromatography and high performance liquid chromatography/electrospray ionization-mass spectrometry were used to study the effect of N-terminal acetylation and the inhibition activity of acetylated enkephalins on the aminopeptidase M (EC 3.4.11.2)-catalyzed hydrolysis of methionine (Met-enk) and leucine enkephalins (Leu-enk). Acetylation imparts a significant enhancement in the proteolytic stability of these two peptides. After 30 min of the reaction, < 10% of both acetylated enkephalins was hydrolyzed. In an 8-h incubation period, only a maximum of 54% acetylated (Ac)-Met-enk and 38% Ac-Leu-enk was hydrolyzed. Vmax and Km [infil] for the degradation of Ac-Met-enk were 1.4 nmol/min/50 ng and 2.2 mM, respectively. The corresponding values for the reaction of Ac-Leu-enk were 0.5 nmol/min/50 ng and 0.9 mM. Also, the aminopeptidase M activity on Met-enk can be inhibited in the presence of Ac-Met-enk, which acts as a mixed-type inhibitor with the inhibition constant (K(i)) of I x 10(-3) M.
Figures


Similar articles
-
Phosphorylation of enkephalins enhances their proteolytic stability.Life Sci. 1996;58(13):1039-45. doi: 10.1016/0024-3205(96)00057-4. Life Sci. 1996. PMID: 8622556
-
Effects of three peptidase inhibitors, amastatin, captopril and phosphoramidon, on the hydrolysis of [Met5]-enkephalin-Arg6-Phe7 and other opioid peptides.Naunyn Schmiedebergs Arch Pharmacol. 1998 Mar;357(3):276-82. doi: 10.1007/pl00005168. Naunyn Schmiedebergs Arch Pharmacol. 1998. PMID: 9550299
-
The specificities of yeast methionine aminopeptidase and acetylation of amino-terminal methionine in vivo. Processing of altered iso-1-cytochromes c created by oligonucleotide transformation.J Biol Chem. 1990 Nov 15;265(32):19638-43. J Biol Chem. 1990. PMID: 2174047
-
Enkephalins and immune inflammatory reactions.Acta Neurol (Napoli). 1991 Oct;13(5):433-41. Acta Neurol (Napoli). 1991. PMID: 1663693 Review.
-
Enkephalins, brain and immunity: modulation of immune responses by methionine-enkephalin injected into the cerebral cavity.Int J Neurosci. 1992 Nov-Dec;67(1-4):241-70. doi: 10.3109/00207459208994788. Int J Neurosci. 1992. PMID: 1305637 Review.
Cited by
-
Chemical Modifications to Enhance the Drug Properties of a VIP Receptor Antagonist (ANT) Peptide.Int J Mol Sci. 2024 Apr 16;25(8):4391. doi: 10.3390/ijms25084391. Int J Mol Sci. 2024. PMID: 38673976 Free PMC article.
-
The multifaceted nature of antimicrobial peptides: current synthetic chemistry approaches and future directions.Chem Soc Rev. 2021 Jul 5;50(13):7820-7880. doi: 10.1039/d0cs00729c. Chem Soc Rev. 2021. PMID: 34042120 Free PMC article. Review.
-
Peptide design for antimicrobial and immunomodulatory applications.Biopolymers. 2013 Nov;100(6):572-83. doi: 10.1002/bip.22250. Biopolymers. 2013. PMID: 23553602 Free PMC article. Review.
-
An Effective and Safe Enkephalin Analog for Antinociception.Pharmaceutics. 2021 Jun 22;13(7):927. doi: 10.3390/pharmaceutics13070927. Pharmaceutics. 2021. PMID: 34206631 Free PMC article.
-
Antimicrobial Peptides: Diversity, Mechanism of Action and Strategies to Improve the Activity and Biocompatibility In Vivo.Biomolecules. 2018 Jan 19;8(1):4. doi: 10.3390/biom8010004. Biomolecules. 2018. PMID: 29351202 Free PMC article. Review.
References
-
- Almenoff J., Orlowski M. Membrane-bound kidney neutral mettalloendopeptidase: interaction with synthetic substrates, natural substrates, natural peptides and inhibitors. Biochemistry. 1986;22:590–599. - PubMed
-
- Beamount A., Fournie–Zalaski M., Rocques B.P. Neutral endopeptidase-24.11: structure, and design and clinical use of inhibitors. In: Hooper N.M., editor. Zinc metalloproteases in health and disease. Taylor & Francis; London: 1996. pp. 105–129.
-
- Benter I.F., Hirsh E.M., Tuchman A.J., Ward P.E. N-terminal degradation of low molecular weight opioid peptides in human cerebrospinal fluid. Biochem Pharmacol. 1990;40:465–472. - PubMed
-
- Boarder M.R., McArdale W. Breakdown of small enkephalin derivatives and adrenal peptide E by human plasma. Biochem Pharmacol. 1986;35:1043–1047. - PubMed
-
- Cornish–Bowden A. Fundamentals of enzyme kinetics. Portland Press; London: 1995.
Publication types
MeSH terms
Substances
Grants and funding
LinkOut - more resources
Full Text Sources
Other Literature Sources
Research Materials
Miscellaneous
