. 1999 Oct 4;147(1):13-24.
doi: 10.1083/jcb.147.1.13.

Spatial relationship between transcription sites and chromosome territories

Affiliations

Spatial relationship between transcription sites and chromosome territories

P J Verschure et al. J Cell Biol. .

Abstract

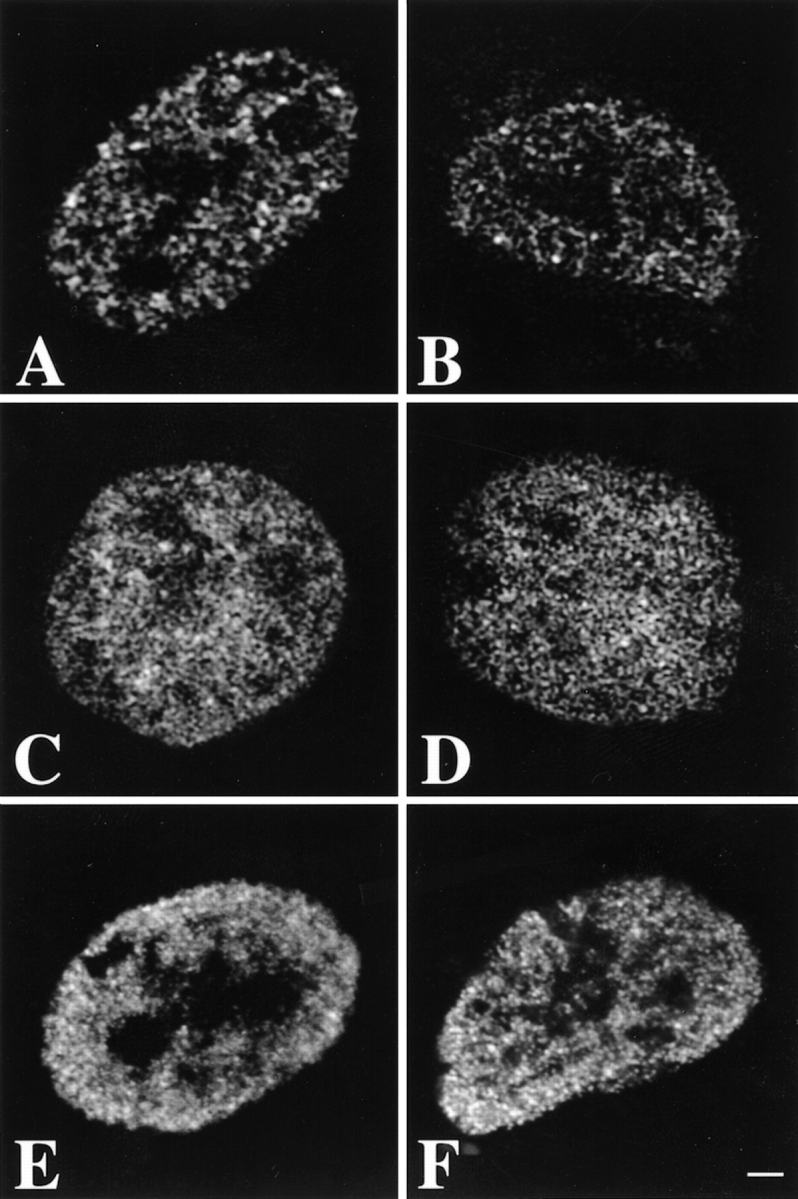
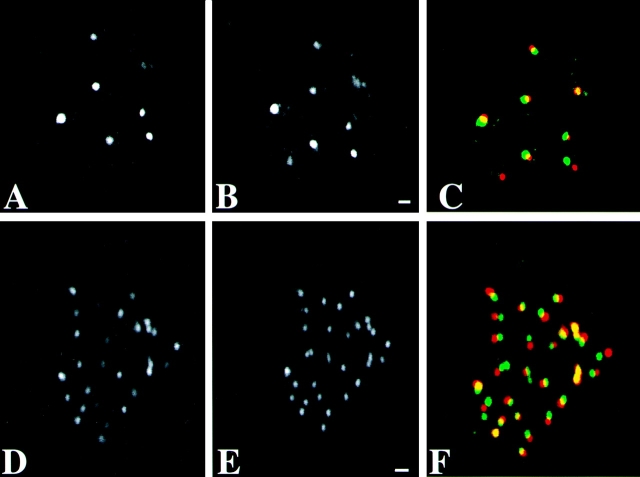
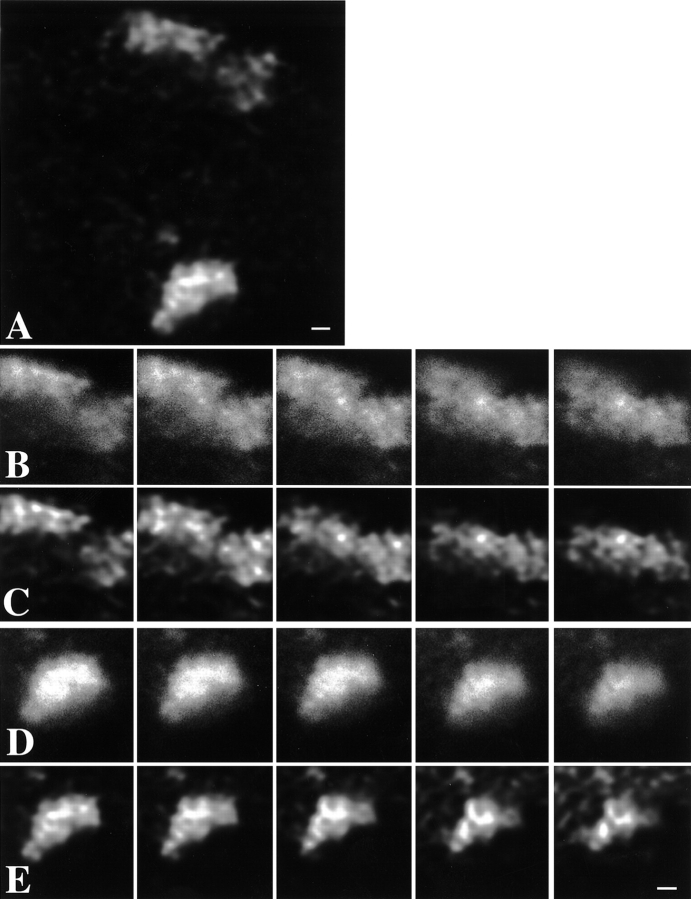
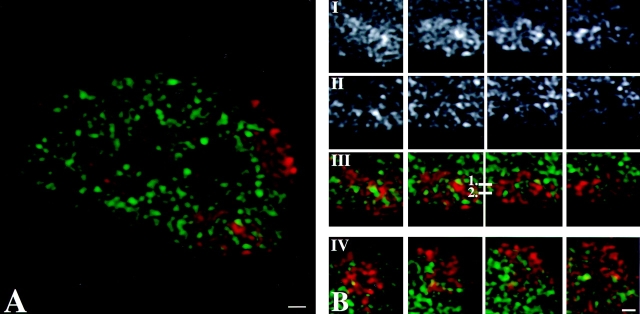
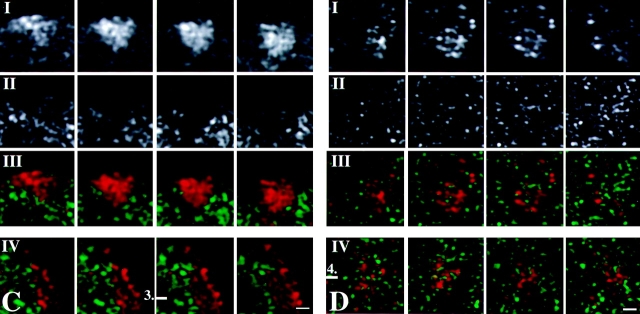
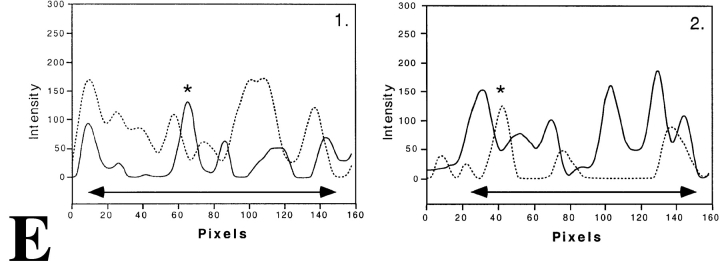
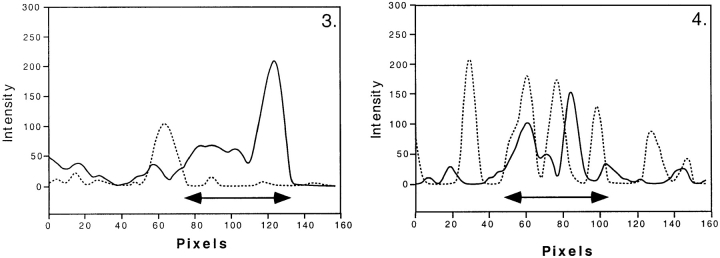
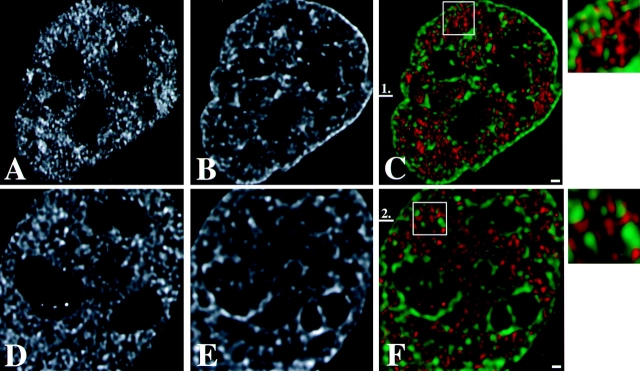
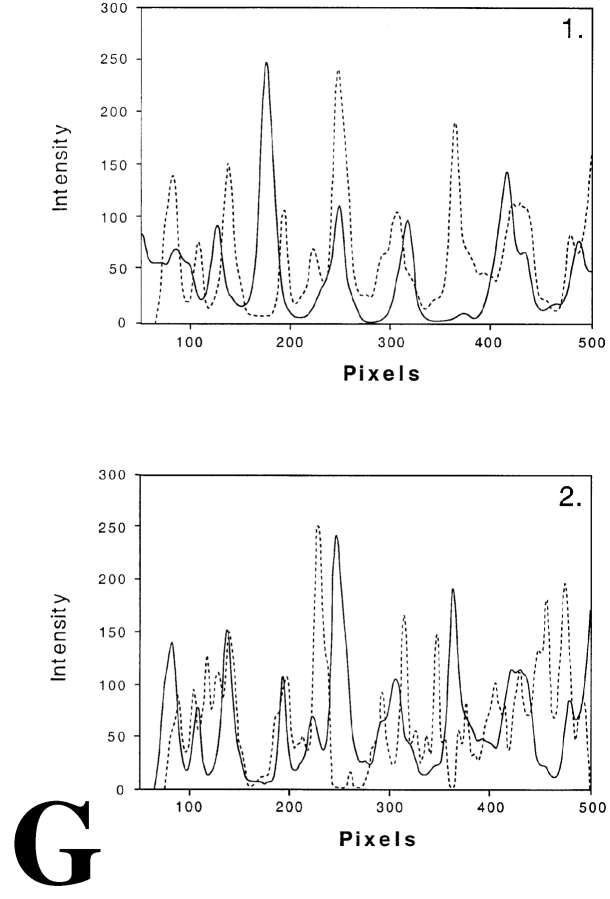
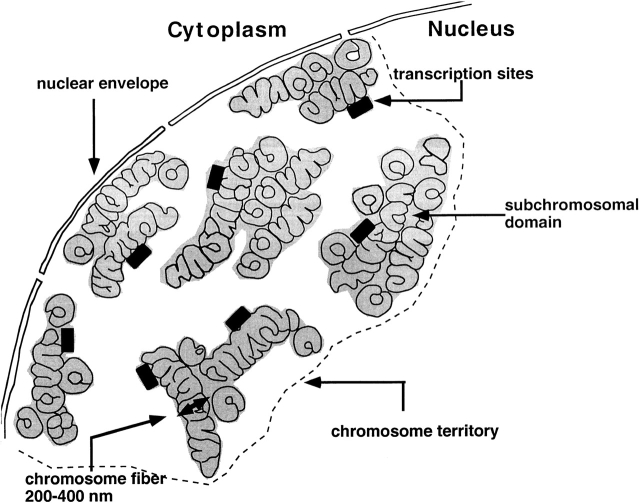
We have investigated the spatial relationship between transcription sites and chromosome territories in the interphase nucleus of human female fibroblasts. Immunolabeling of nascent RNA was combined with visualization of chromosome territories by fluorescent in situ hybridization (FISH). Transcription sites were found scattered throughout the territory of one of the two X chromosomes, most likely the active X chromosome, and that of both territories of chromosome 19. The other X chromosome territory, probably the inactive X chromosome, was devoid of transcription sites. A distinct substructure was observed in interphase chromosome territories. Intensely labeled subchromosomal domains are surrounded by less strongly labeled areas. The intensely labeled domains had a diameter in the range of 300-450 nm and were sometimes interconnected, forming thread-like structures. Similar large scale chromatin structures were observed in HeLa cells expressing green fluorescent protein (GFP)-tagged histone H2B. Strikingly, nascent RNA was almost exclusively found in the interchromatin areas in chromosome territories and in between strongly GFP-labeled chromatin domains. These observations support a model in which transcriptionally active chromatin in chromosome territories is markedly compartmentalized. Active loci are located predominantly at or near the surface of compact chromatin domains, depositing newly synthesized RNA directly into the interchromatin space.


Figures

Figure 1
Figure 1
Preservation of the spatial distribution of nascent RNA, DNA, and acetylated histone H4 in human primary fibroblasts during the FISH procedure. Optical sections were obtained before (A, C, and E) and after (B, D, and F) carrying out the FISH protocol. A and B, Optical sections of nuclei in which transcription sites were immunofluorescently labeled. The distribution of nascent RNA did not change significantly during the FISH procedure. C and D, Optical sections of nuclei labeled with the fluorescent DNA stain Sytox green. The pattern of DNA staining did not change significantly after in situ hybridization. E and F, Optical sections of nuclei in which acetylated histone H4 was fluorescently labeled. The distribution did not change significantly during the chromosome painting procedure. The diffuse, low intensity labeling observed before FISH was diminished after the procedure, resulting in a somewhat more pronounced granular labeling. Images shown have been subjected to 3-D image restoration. Bar, 1.75 μm.
Figure 2
Figure 2
Preservation of the spatial distribution of centromeres and PML bodies in human primary fibroblasts during the FISH procedure. The spatial distribution of PML bodies and of centromeres were analyzed before and after the FISH procedure in the same nucleus. A, B, and C, Corresponding individual optical sections of the same nucleus labeled with anti-PML antibody are shown in A (before the FISH procedure) and B (after FISH). C shows an overlay of A (red) and B (green). Bar, 0.84 μm. D, E, and F, Corresponding individual optical sections of the same nucleus labeled with anticentromere antibody. D, Before FISH procedure. E, After FISH procedure. F shows an overlay of D (red) and E (green). The FISH procedure results in only small changes in the distribution of PML bodies and centromeres. These changes are in part due to a slight tilting of the nuclei during FISH labeling. Bar, 0.84 μm.
Figure 3
Figure 3
Chromosome territories have a distinct substructure. X chromosome territories in nuclei of female primary fibroblasts were labeled by FISH, using a chromosome-specific DNA probe library. A, Single optical section through the center of a nucleus showing two labeled X chromosome territories. The image has undergone 3-D image restoration. Bar, 2.1 μm. C and E, Five consecutive optical sections (step size along z-axis is 0.2 μm) showing structural details of the two territories visible in A. The images shown have been subjected to 3-D image restoration. Territories show strongly labeled chromosomal subdomains surrounded by less intensely labeled areas. Intensely labeled chromosomal subdomains have a diameter in the range of 300–450 nm. In several cases, subchromosomal domains appear interconnected, forming thread-like structures (also see Fig. 4). Bar, 4.2 μm. B and D, Same optical sections as in C and E, respectively. Shown are unprocessed, crude images that have not undergone 3-D image restoration. Structural details that are enhanced after 3-D image restoration are visible in the unprocessed optical sections. Bar, 4.2 μm.
Figure 4
Figure 4
Distribution of transcription sites in relation to territories of the two X chromosomes and chromosome 19 in female primary fibroblasts. Labeling of nascent RNA by incorporation of BrUTP (green) in permeabilized cells (run-on-transcription) is combined with FISH labeling of X chromosome territories (A–C) and of chromosome 19 territories (D). In all nuclei analyzed, transcription sites occur as defined spots throughout one of the two X chromosome territories (most likely Xa; B) and in both chromosome 19 territories (D). Almost no transcription sites are observed in the other X chromosome territory (most likely Xi; C). Nascent RNA preferentially accumulates between the chromosomal subdomains in the areas with little or no FISH label. A, Single optical section through the center of a cell nucleus with labeled Xa and Xi chromosome territories (red) and transcription sites (green). Bar, 0.875 μm. B, Four consecutive optical sections (z-distance 0.2 μm) through an X chromosome territory that contains transcription sites (most likely Xa). I and II represent consecutive optical sections of the X chromosome territory and of transcription sites, respectively. III shows the overlay of the chromosome territory (red) and the transcription sites (green). IV shows in another nucleus an X-chromosome territory (red) containing transcription sites (green). Bar, 0.66 μm. C, Four consecutive optical sections (z-distance 0.2 μm) through a single X chromosome territory not containing transcription sites (most likely Xi). I and II represent consecutive optical sections of the X chromosome territory and transcription sites, respectively. III shows the overlay of the chromosome territory (red) and the transcription sites (green). IV shows in another nucleus an X-chromosome territory (red) that does not contain transcription sites (green). Bar, 0.66 μm. D, Four consecutive optical sections (z-distance 0.2 μm) through a single chromosome 19 territory. I and II represent consecutive optical sections of the chromosome 19 territory and transcription sites, respectively. III shows the overlay of the chromosome territory (red) and the transcription sites (green), respectively. IV shows a chromosome 19 territory (red) and transcription sites (green) in another nucleus. Bar, 0.66 μm. All images shown have undergone 3-D image restoration. Bar, 0.66 μm. E, Line scans through individual Xa, Xi and chromosome 19 territories. The dotted curve represents the local intensity of the nascent RNA signal, the continuous line shows the intensity distribution of the FISH-labeled chromosome. Line scans are shown through the Xa (1 and 2), Xi (3), and chromosome 19 (4) territories. The position of each line scan is indicated by a horizontal bar with a number in B and C (chromosome Xa and Xi, respectively) and D (chromosome 19). Transcription sites with their center of gravity precisely on the line are marked with an asterisk in 1 and 2. The two-arrow horizontal line below the intensity distributions marks the size of the chromosome territory.
Figure 4
Figure 4
Distribution of transcription sites in relation to territories of the two X chromosomes and chromosome 19 in female primary fibroblasts. Labeling of nascent RNA by incorporation of BrUTP (green) in permeabilized cells (run-on-transcription) is combined with FISH labeling of X chromosome territories (A–C) and of chromosome 19 territories (D). In all nuclei analyzed, transcription sites occur as defined spots throughout one of the two X chromosome territories (most likely Xa; B) and in both chromosome 19 territories (D). Almost no transcription sites are observed in the other X chromosome territory (most likely Xi; C). Nascent RNA preferentially accumulates between the chromosomal subdomains in the areas with little or no FISH label. A, Single optical section through the center of a cell nucleus with labeled Xa and Xi chromosome territories (red) and transcription sites (green). Bar, 0.875 μm. B, Four consecutive optical sections (z-distance 0.2 μm) through an X chromosome territory that contains transcription sites (most likely Xa). I and II represent consecutive optical sections of the X chromosome territory and of transcription sites, respectively. III shows the overlay of the chromosome territory (red) and the transcription sites (green). IV shows in another nucleus an X-chromosome territory (red) containing transcription sites (green). Bar, 0.66 μm. C, Four consecutive optical sections (z-distance 0.2 μm) through a single X chromosome territory not containing transcription sites (most likely Xi). I and II represent consecutive optical sections of the X chromosome territory and transcription sites, respectively. III shows the overlay of the chromosome territory (red) and the transcription sites (green). IV shows in another nucleus an X-chromosome territory (red) that does not contain transcription sites (green). Bar, 0.66 μm. D, Four consecutive optical sections (z-distance 0.2 μm) through a single chromosome 19 territory. I and II represent consecutive optical sections of the chromosome 19 territory and transcription sites, respectively. III shows the overlay of the chromosome territory (red) and the transcription sites (green), respectively. IV shows a chromosome 19 territory (red) and transcription sites (green) in another nucleus. Bar, 0.66 μm. All images shown have undergone 3-D image restoration. Bar, 0.66 μm. E, Line scans through individual Xa, Xi and chromosome 19 territories. The dotted curve represents the local intensity of the nascent RNA signal, the continuous line shows the intensity distribution of the FISH-labeled chromosome. Line scans are shown through the Xa (1 and 2), Xi (3), and chromosome 19 (4) territories. The position of each line scan is indicated by a horizontal bar with a number in B and C (chromosome Xa and Xi, respectively) and D (chromosome 19). Transcription sites with their center of gravity precisely on the line are marked with an asterisk in 1 and 2. The two-arrow horizontal line below the intensity distributions marks the size of the chromosome territory.
Figure 5
Figure 5
Distribution of transcription sites in relation to chromatin in HeLa cells expressing GFP tagged histone H2B. Transcription sites were visualized after in vivo incorporation of BrUTP into nascent RNA. Nascent RNA accumulated preferentially in nuclear domains that contain little or no GFP-labeled chromatin. A and D, Single optical sections of two different nuclei showing the distribution of transcription sites. B and E, Same optical as shown in A and D, respectively, showing the distribution of GFP-histone H2B. C and F, Overlay of A and B, and D and E, respectively, showing the spatial relationship between transcription sites (red) and chromatin domains (green). Magnified areas in C and F (white squares) are shown in the inserts at the right. The images show that nascent RNA is predominantly found in areas that contain little or no GFP-labeled chromatin. All images shown are subjected to 3-D image restoration. G, Line scans through compact GFP-histone H2B domains and transcription sites. The dotted curve represents the local intensity of the nascent RNA signal, the continuous line shows the intensity distribution of the GFP-histone H2B signal. The position of the line scan is indicated by a horizontal bar with a number in C (1) and F (2). Bars, 0.6 μm.
Figure 5
Figure 5
Distribution of transcription sites in relation to chromatin in HeLa cells expressing GFP tagged histone H2B. Transcription sites were visualized after in vivo incorporation of BrUTP into nascent RNA. Nascent RNA accumulated preferentially in nuclear domains that contain little or no GFP-labeled chromatin. A and D, Single optical sections of two different nuclei showing the distribution of transcription sites. B and E, Same optical as shown in A and D, respectively, showing the distribution of GFP-histone H2B. C and F, Overlay of A and B, and D and E, respectively, showing the spatial relationship between transcription sites (red) and chromatin domains (green). Magnified areas in C and F (white squares) are shown in the inserts at the right. The images show that nascent RNA is predominantly found in areas that contain little or no GFP-labeled chromatin. All images shown are subjected to 3-D image restoration. G, Line scans through compact GFP-histone H2B domains and transcription sites. The dotted curve represents the local intensity of the nascent RNA signal, the continuous line shows the intensity distribution of the GFP-histone H2B signal. The position of the line scan is indicated by a horizontal bar with a number in C (1) and F (2). Bars, 0.6 μm.
Figure 6
Figure 6
Chromosome territory structure and transcription sites. The cartoon shows a thin section of an interphase nucleus, highlighting a single chromosome territory only. The chromosome fiber is shown, which follows an irregular and convoluted path in the chromosome territory, similar to the chromonema fiber proposed by Belmont and Bruce 1994. In the section, the chromosome fiber is cut perpendicular, oblique, and parallel with respect to the fiber axis. Often, different parts of the chromosome fiber come close together, forming compact subchromosomal domains (gray areas), in which the individual fiber cannot be distinguished. Transcriptionally active chromatin is markedly compartmentalized. Active loci (indicated by black rectangles) are located predominantly at or near the surface of compact chromatin domains. The interchromatin space inside a chromosome territory is continuous with the interchromosomal domain.

References

    1. Abranches R., Beven A.F., Aragon-Alcaide L., Shaw P.L. Transcription sites are not correlated with chromosome territories in wheat nuclei. J. Cell Biol. 1998;143:5–12. - PMC - PubMed
    1. Belmont A.S., Bruce K. Visualization of G1 chromosomesa folded, twisted, supercoiled chromonema model of interphase chromatid structure. J. Cell Biol. 1994;127:287–302. - PMC - PubMed
    1. Belmont A.S., Braunfield M.B., Sedat J.W., Agard D.A. Large-scale Chromatin structural domains within mitotic and interphase chromosomes in vivo and in vitro. Chromosoma. 1989;98:129–143. - PubMed
    1. Brakenhoff G.J., Van der Voort H.T.M., Van Spronsen E.A., Linnemans W.A.M., Nanninga N. Three-dimensional chromatin distribution in neuroblastoma nuclei shown by confocal scanning laser microscopy. Nature. 1985;317:748–749. - PubMed
    1. Braunstein M., Rose A.B., Holmes S.G., Allis C.D., Broach J.R. Transcriptional silencing in yeast is associated with reduced histone acetylation. Genes Dev. 1993;7:592–604. - PubMed

Publication types

MeSH terms