. 1999 Oct 4;190(7):895-902.
doi: 10.1084/jem.190.7.895.

Crucial role of the interleukin 1 receptor family member T1/ST2 in T helper cell type 2-mediated lung mucosal immune responses

Affiliations

Crucial role of the interleukin 1 receptor family member T1/ST2 in T helper cell type 2-mediated lung mucosal immune responses

A J Coyle et al. J Exp Med. .

Abstract

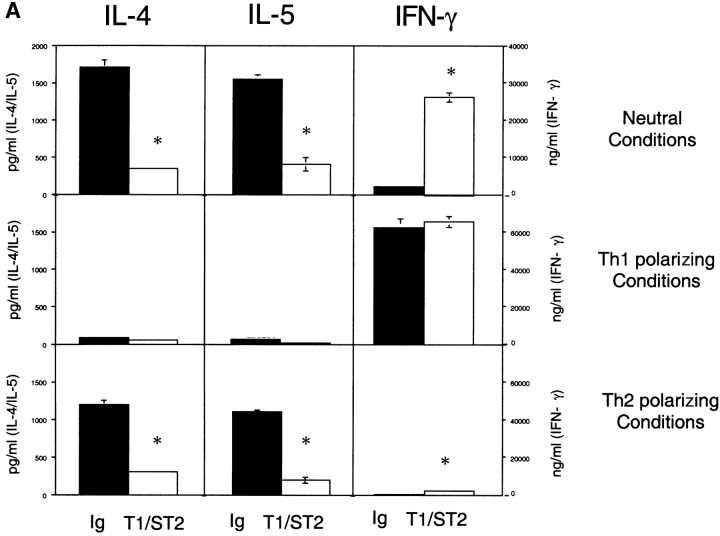
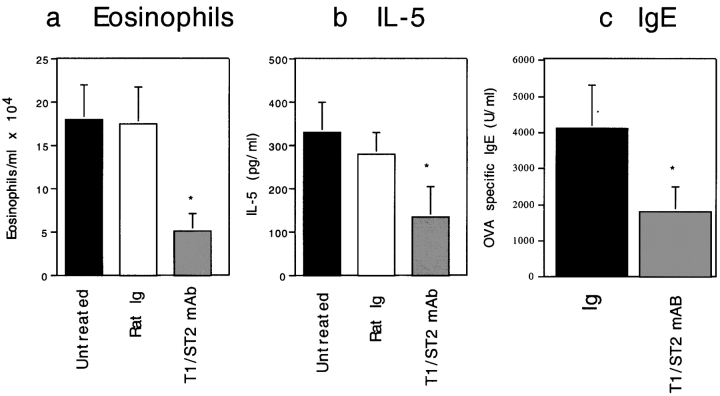
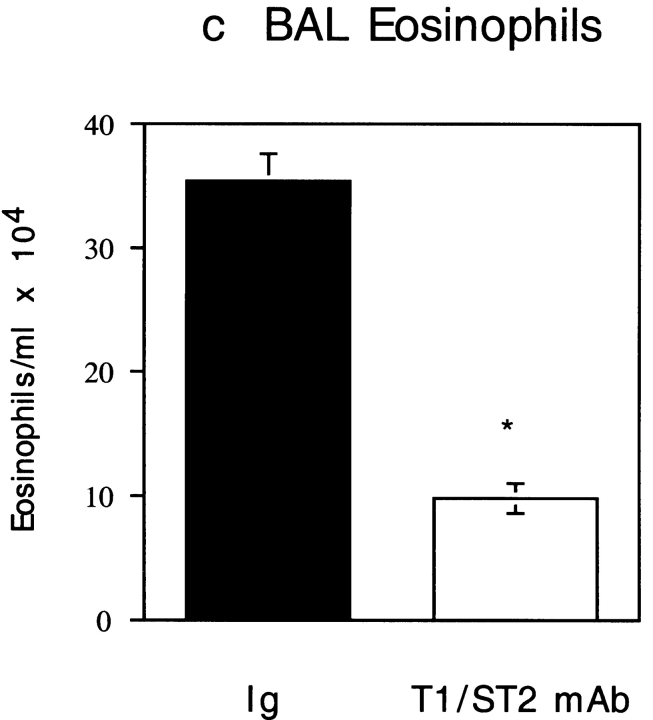
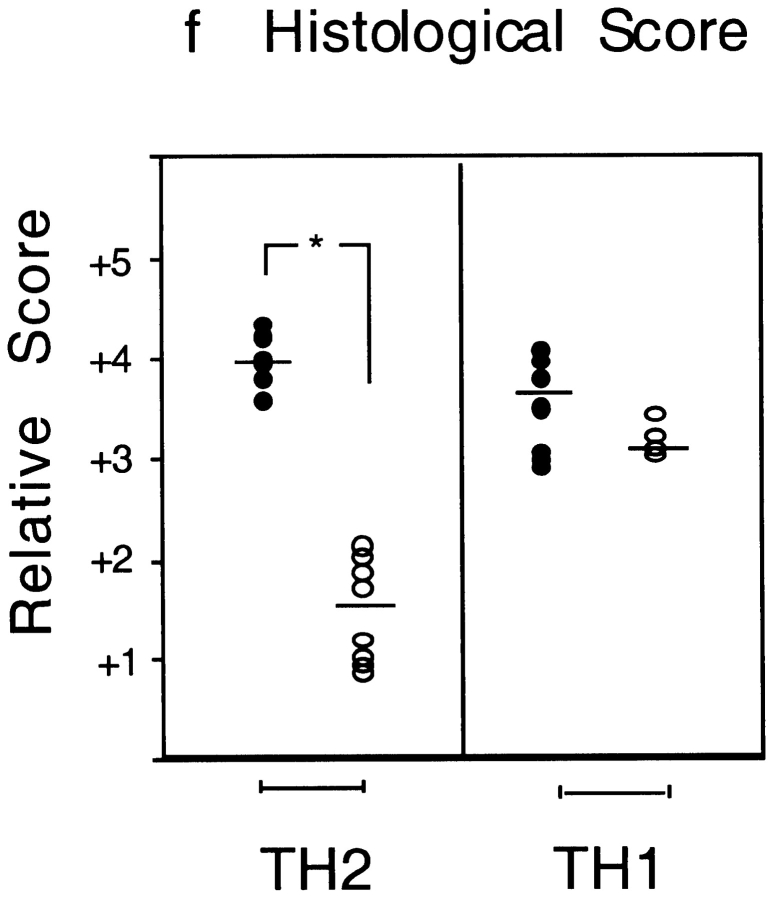
T1/ST2 is an orphan receptor of unknown function that is expressed on the surface of murine T helper cell type 2 (Th2), but not Th1 effector cells. In vitro blockade of T1/ST2 signaling with an immunoglobulin (Ig) fusion protein suppresses both differentiation to and activation of Th2, but not Th1 effector populations. In a nascent Th2-dominated response, anti-T1/ST2 monoclonal antibody (mAb) inhibited eosinophil infiltration, interleukin 5 secretion, and IgE production. To determine if these effects were mediated by a direct effect on Th2 cells, we next used a murine adoptive transfer model of Th1- and Th2-mediated lung mucosal immune responses. Administration of either T1/ST2 mAb or T1/ST2-Ig abrogated Th2 cytokine production in vivo and the induction of an eosinophilic inflammatory response, but failed to modify Th1-mediated inflammation. Taken together, our data demonstrate an important role of T1/ST2 in Th2-mediated inflammatory responses and suggest that T1/ST2 may prove to be a novel target for the selective suppression of Th2 immune responses.


Figures

Figure 1
Figure 1
T1/ST2 is expressed on the surface of Th2 cells. T1/ST2 expression was determined by flow cytometry on (A) splenocytes, (B) purified naive CD4+ (CD4+/CD62L+), or (C) Th2 and (D) Th1 effector populations after primary, secondary, or tertiary restimulation under the indicated polarizing conditions.
Figure 2
Figure 2
T1/ST2 signaling is critical for differentiation to and activation of Th2 effector cells. (A) Cytokine production from antigen-restimulated CD4+ T cells differentiated with OVA peptide alone (Neutral Conditions), IL-12 plus anti–IL-4 mAb (Th1 polarizing Conditions), or IL-4 and anti–IL-12 (Th2 polarizing Conditions) for 5 d in the presence of hIg (black bars) or T1/ST2-Ig (white bars). Data are shown as the mean ± SEM of triplicate wells and are representative of three different experiments. Statistical significance (*P < 0.01) was determined by Student's t test. (B) Th1 and Th2 effector populations were generated by two rounds of stimulation under the appropriate conditions. Effector populations were then activated with peptide and mitomycin C–treated splenocytes in the presence of either hIg (100 μg/ml; □) or T1/ST2-Ig (1–100 μg/ml) as indicated. In some experiments, a second irrelevant hIg fusion protein was included (H1-Ig; ▪). Data are shown as the mean ± SEM of triplicate wells and are representative of four different experiments.
Figure 2
Figure 2
T1/ST2 signaling is critical for differentiation to and activation of Th2 effector cells. (A) Cytokine production from antigen-restimulated CD4+ T cells differentiated with OVA peptide alone (Neutral Conditions), IL-12 plus anti–IL-4 mAb (Th1 polarizing Conditions), or IL-4 and anti–IL-12 (Th2 polarizing Conditions) for 5 d in the presence of hIg (black bars) or T1/ST2-Ig (white bars). Data are shown as the mean ± SEM of triplicate wells and are representative of three different experiments. Statistical significance (*P < 0.01) was determined by Student's t test. (B) Th1 and Th2 effector populations were generated by two rounds of stimulation under the appropriate conditions. Effector populations were then activated with peptide and mitomycin C–treated splenocytes in the presence of either hIg (100 μg/ml; □) or T1/ST2-Ig (1–100 μg/ml) as indicated. In some experiments, a second irrelevant hIg fusion protein was included (H1-Ig; ▪). Data are shown as the mean ± SEM of triplicate wells and are representative of four different experiments.
Figure 3
Figure 3
Inhibition of cellular and humoral responses in an active immunization model by anti-T1/ST2 mAb. 1 h before each allergen administration, mice were injected with 100 μg of either rat IgG1 (white bars) or anti-T1/ST2 mAb (gray bars). Untreated allergen-exposed mice (black bars) are shown for comparison. Data are shown as the mean ± SEM of n = 4–9 animals. Statistical significance (*P < 0.05) was determined by Student's t test.
Figure 4
Figure 4
Anti-T1/ST2 mAb administration inhibits IL-4, IL-5, IL-6, and IL-13 secretion in the BAL fluid. Allergen exposure of Th2 recipient mice resulted in marked elevations in IL-4, IL-5, IL-6, IL-10, and IL-13 in the BAL fluid (black bars). Cytokine levels were below the level of detection (<10 pg/ml) in Th2 recipient mice that were exposed to PBS (data not shown). Mice were treated with either 20 or 100 μg of anti-T1/ST2 mAb (white bars). OVA challenge of Th1 recipient mice (inset) resulted in high levels of IFN-γ in the BAL fluid (black bars) that were not inhibited by T1/ST2 mAb (white bars). Data are shown as the mean ± SEM of n = 5–6 animals. Statistical significance (*P < 0.01) was determined by Student's t test.
Figure 5
Figure 5
Anti-T1/ST2 mAb inhibits Th2-mediated allergic lung inflammation and airway hyperresponsiveness. Representative lung histology for Th2 recipient, OVA-exposed (a) control isotype-treated or (b) anti-T1/ST2 mAb–treated mice. Panel c shows eosinophil number in the BAL fluid (cells/ml × 104) in rat Ig–treated (black bars) or anti-T1/ST2 mAb–treated Th2 recipient mice (white bars), and data are shown as mean ± SEM of n = 5–6 animals. Similar data were generated using T1/ST2-Ig fusion protein (data not shown). Statistical significance (*P < 0.01) was determined by Student's t test. In contrast to the effects of anti-T1/ST2 mAb on Th2-mediated pathology, there was no effect of T1/ST2 mAb on Th1-mediated lung pathology (e) compared with Th1 recipient mice treated with control rat Ig (d), summarized in panel f where the circles represent individual mice treated with either rat Ig (•) or anti-T1/ST2 mAb (○). Statistical significance (*P < 0.01) was determined by Student's t test. (g) OVA exposure in control Ig–treated, Th2 recipient mice resulted in airway hyperresponsiveness (⋄) compared with recipient mice that were exposed to PBS (and treated with anti-T1/ST2 mAb; □). Pretreatment with anti-T1/ST2 mAb inhibited OVA-induced bronchial hyperresponsiveness (○). The results are shown as the mean ± SEM of n = 5–10 mice.
Figure 5
Figure 5
Anti-T1/ST2 mAb inhibits Th2-mediated allergic lung inflammation and airway hyperresponsiveness. Representative lung histology for Th2 recipient, OVA-exposed (a) control isotype-treated or (b) anti-T1/ST2 mAb–treated mice. Panel c shows eosinophil number in the BAL fluid (cells/ml × 104) in rat Ig–treated (black bars) or anti-T1/ST2 mAb–treated Th2 recipient mice (white bars), and data are shown as mean ± SEM of n = 5–6 animals. Similar data were generated using T1/ST2-Ig fusion protein (data not shown). Statistical significance (*P < 0.01) was determined by Student's t test. In contrast to the effects of anti-T1/ST2 mAb on Th2-mediated pathology, there was no effect of T1/ST2 mAb on Th1-mediated lung pathology (e) compared with Th1 recipient mice treated with control rat Ig (d), summarized in panel f where the circles represent individual mice treated with either rat Ig (•) or anti-T1/ST2 mAb (○). Statistical significance (*P < 0.01) was determined by Student's t test. (g) OVA exposure in control Ig–treated, Th2 recipient mice resulted in airway hyperresponsiveness (⋄) compared with recipient mice that were exposed to PBS (and treated with anti-T1/ST2 mAb; □). Pretreatment with anti-T1/ST2 mAb inhibited OVA-induced bronchial hyperresponsiveness (○). The results are shown as the mean ± SEM of n = 5–10 mice.

Similar articles

Cited by

References

    1. Ho I.C., Hodge M.R., Rooney J.W., Glimcher L.H. The proto-oncogene c-maf is responsible for tissue-specific expression of interleukin-4. Cell. 1996;85:973–983. - PubMed
    1. Zheng W., Flavell R. The transcription factor GATA-3 is necessary and sufficient for Th2 cytokine gene expression in CD4 T cells. Cell. 1997;89:587–596. - PubMed
    1. Zhang D.-H., Cohn L., Ray P., Bottomly K., Ray A. Transcription factor GATA-3 is differentially expressed in murine Th1 and Th2 cells and controls Th2-specific expression of the interleukin-5 gene. J. Biol. Chem. 1997;272:21597–21603. - PubMed
    1. Ouyang W., Ranganath S.H., Weindel K., Bhattacharya D., Murphy T.L., Sha W.C., Murphy K.M. Inhibition of Th1 development mediated by GATA-3 through an IL-4-independent mechanism. Immunity. 1998;9:745–755. - PubMed
    1. Sallusto F., Mackay C.R., Lanzavecchia A. Selective expression of the eotaxin receptor CCR3 by human T helper 2 cells. Science. 1997;277:2005–2007. - PubMed

Publication types

MeSH terms