. 1999 Oct 4;190(7):943-52.
doi: 10.1084/jem.190.7.943.

Receptor avidity and costimulation specify the intracellular Ca2+ signaling pattern in CD4(+)CD8(+) thymocytes

Affiliations

Receptor avidity and costimulation specify the intracellular Ca2+ signaling pattern in CD4(+)CD8(+) thymocytes

B D Freedman et al. J Exp Med. .

Abstract

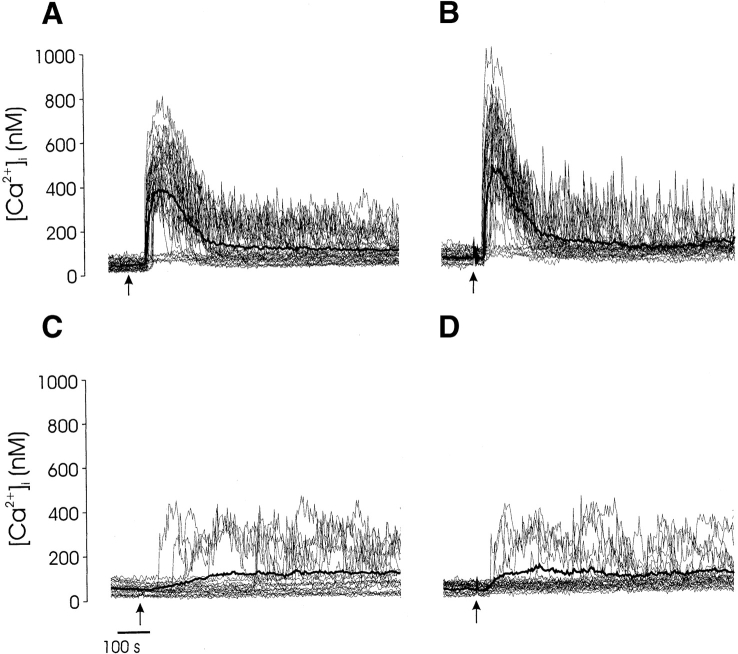
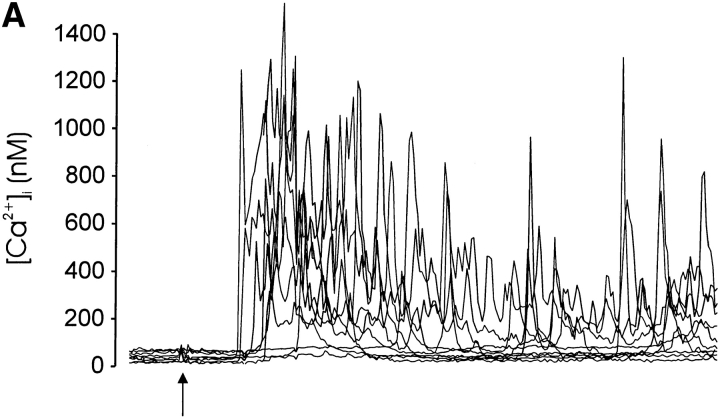
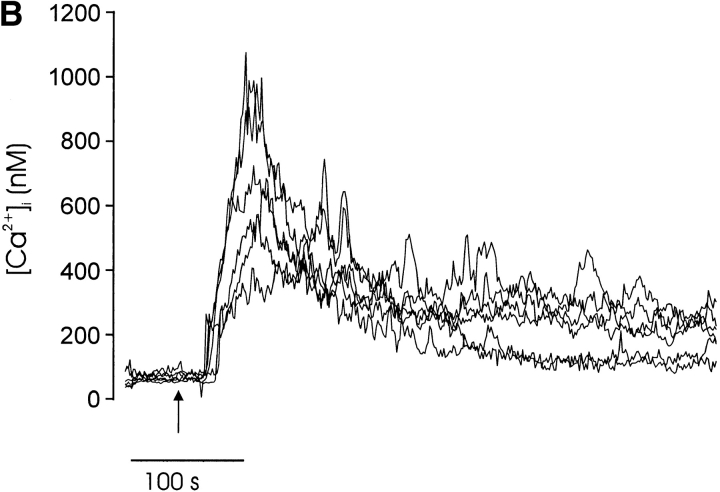
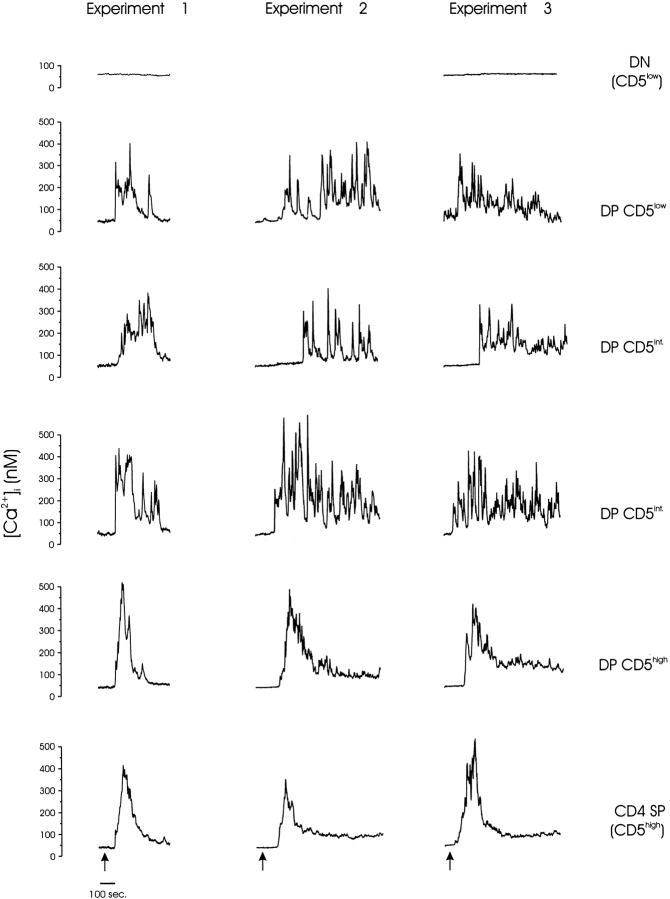
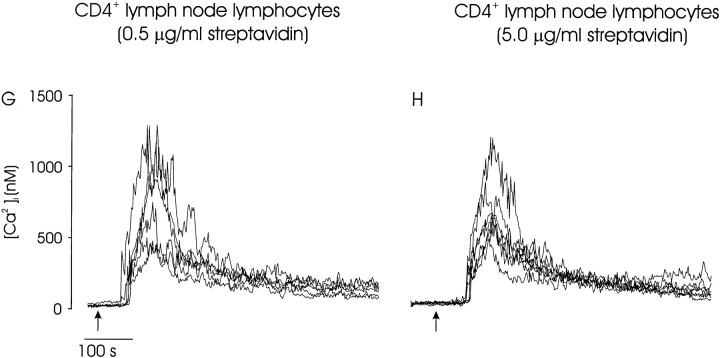
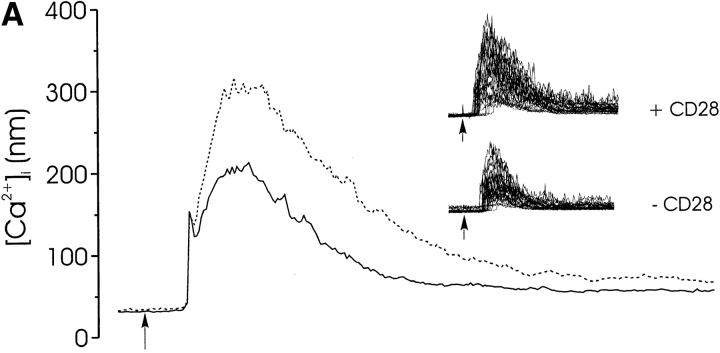
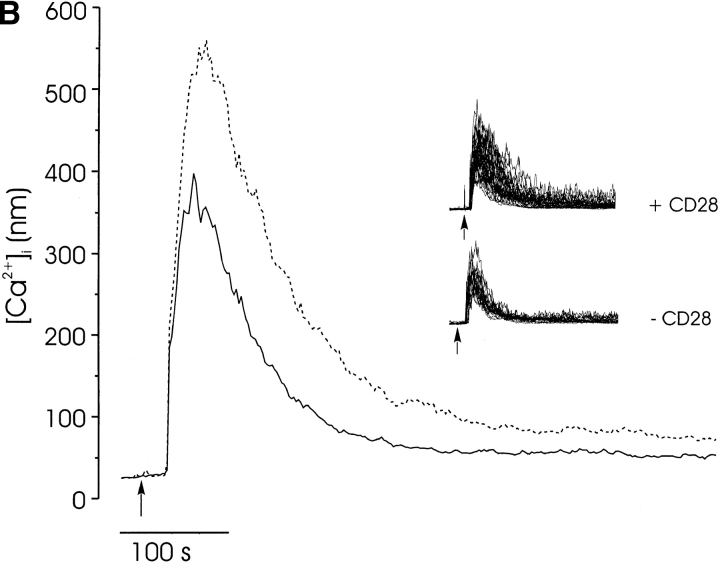
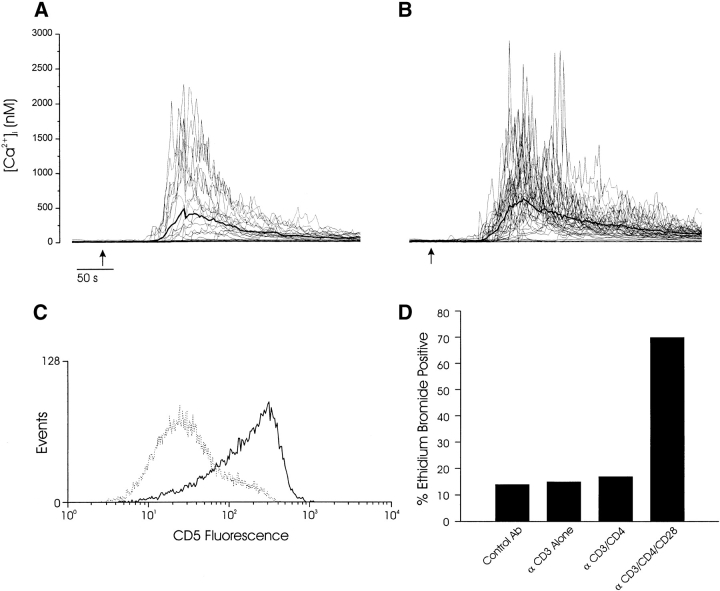
Thymocyte maturation is governed by antigen-T cell receptor (TCR) affinity and the extent of TCR aggregation. Signals provided by coactivating molecules such as CD4 and CD28 also influence the fate of immature thymocytes. The mechanism by which differences in antigen-TCR avidity encode unique maturational responses of lymphocytes and the influence of coactivating molecules on these signaling processes is not fully understood. To better understand the role of a key second messenger, calcium, in governing thymocyte maturation, we measured the intracellular free calcium concentration ([Ca2+]i) response to changes in TCR avidity and costimulation. We found that TCR stimulation initiates either amplitude- or frequency-encoded [Ca2+]i changes depending on (a) the maturation state of stimulated thymocytes, (b) the avidity of TCR interactions, and (c) the participation of specific coactivating molecules. Calcium signaling within immature but not mature thymocytes could be modulated by the avidity of CD3/CD4 engagement. Low avidity interactions induced biphasic calcium responses, whereas high avidity engagement initiated oscillatory calcium changes. Notably, CD28 participation converted the calcium response to low avidity receptor engagement from a biphasic to oscillatory pattern. These data suggest that calcium plays a central role in encoding the nature of the TCR signal received by thymocytes and, consequently, a role in thymic selection.


Figures

Figure 1
Figure 1
Thymocyte calcium signaling is dependent upon the coreceptor that is coengaged with TCR/CD3. Unfractionated murine thymocytes were incubated with biotin-conjugated antibodies to CD3 and CD4 (A), TCR and CD4 (B), CD3 and CD28 (C), and CD3 alone (D), and calcium signaling was initiated by the addition of streptavidin (0.5 μg/ml) to the recording chamber (arrow). Each panel is representative of similar results obtained in at least 10 separate experiments. The mean response of all cells is shown for each experiment (bold line).
Figure 2
Figure 2
Different CD3/CD4-evoked calcium signaling patterns in mature and immature lymphocytes. Single-cell [Ca2+]i changes triggered by coaggregation of surface CD3 and CD4. (A) Thymocytes isolated from day 17 fetal thymi were stimulated by bath addition of streptavidin (0.5 mg/ml) at the indicated time (arrow). The majority of cells had either a CD4CD8 (49.5%) or CD4+CD8+ (39.3%) phenotype. No TCRhigh cells were identified in these populations, although a proportion of DP thymocytes expressed intermediate levels of TCR (data not shown). Only responding thymocytes (17% of all cells) are shown. (B) Lymph node lymphocytes were labeled with biotin-conjugated anti-CD3 and anti-CD4 and were stimulated by bath addition of streptavidin (0.5 μg/ml; arrow) to the recording chamber. Shown is the response of several CD4+ cells, which were identified immediately after the Ca2+ i measurement by in situ staining with PE-conjugated anti-CD4 mAb. These responses are typical of at least three separate experiments.
Figure 2
Figure 2
Different CD3/CD4-evoked calcium signaling patterns in mature and immature lymphocytes. Single-cell [Ca2+]i changes triggered by coaggregation of surface CD3 and CD4. (A) Thymocytes isolated from day 17 fetal thymi were stimulated by bath addition of streptavidin (0.5 mg/ml) at the indicated time (arrow). The majority of cells had either a CD4CD8 (49.5%) or CD4+CD8+ (39.3%) phenotype. No TCRhigh cells were identified in these populations, although a proportion of DP thymocytes expressed intermediate levels of TCR (data not shown). Only responding thymocytes (17% of all cells) are shown. (B) Lymph node lymphocytes were labeled with biotin-conjugated anti-CD3 and anti-CD4 and were stimulated by bath addition of streptavidin (0.5 μg/ml; arrow) to the recording chamber. Shown is the response of several CD4+ cells, which were identified immediately after the Ca2+ i measurement by in situ staining with PE-conjugated anti-CD4 mAb. These responses are typical of at least three separate experiments.
Figure 3
Figure 3
TCR/CD4-mediated calcium responses of phenotypically defined thymocytes. Single-cell video imaging was used to measure Ca2+ i within all thymocytes in a 100× objective field. Biotin-conjugated, mAb-labeled surface CD3 and CD4 were aggregated by addition of streptavidin (0.5 μg/ml) to the bath chamber (arrows). The [Ca2+]i is plotted for individual thymocytes (identified in the bright field image by number) to demonstrate differences in the calcium signaling pattern associated with each maturation phenotype. The composite CD4/CD8/CD5 phenotype of each cell was determined by manually analyzing separate fluorescent images obtained for each receptor in situ, and the aggregate thymocyte phenotype is indicated. The cells shown are representative of all cells of similar phenotype in this experiment, and these data are from three similar experiments. Experiments 1 and 2 were performed at 25°C, and experiment 3 was performed at 37°C.
Figure 4
Figure 4
The effect of maturation and receptor aggregation on calcium signaling in thymocytes. Streptavidin was used to aggregate biotin-conjugated, mAb-labeled surface receptors and trigger calcium signaling within thymocytes. (A) Model of receptor aggregation by streptavidin. At high concentrations of streptavidin (right; streptavidin/biotin ratio >>1), the majority of streptavidin molecules should form monovalent complexes with biotin (stoichiometry of 1:1), resulting in minimal receptor aggregation. At lower streptavidin levels, the biotin/streptavidin stoichiometry will approach 4, resulting in higher receptor aggregation, although the overall number of receptors engaged would begin to decrease as streptavidin became limiting. Maximal receptor aggregation occurs over an intermediate range of streptavidin concentrations. (B) Thymocytes were labeled with biotin-conjugated anti-CD3 and anti-CD4, and separate aliquots were treated with different streptavidin concentrations (0.25–10 μg/ml). Available biotin and streptavidin binding sites were identified by incubating thymocytes with R670-conjugated streptavidin or PE-conjugated biotin, respectively. The relative maximum PE and R670 fluorescence intensities are plotted against the cross-linking streptavidin concentration.
Figure 5
Figure 5
The effect of receptor aggregation on calcium signaling. Ca2+ i signaling was induced by CD3/CD4 coaggregation in thymocytes and peripheral CD4+ lymphocytes under maximal (0.5 μg/ml) and minimal (5.0 μg/ml) aggregating conditions. The calcium responses of thymocytes are plotted together for cells expressing low (A and B), intermediate (C and D), or high (E and F) levels of CD5. Several representative traces are shown for each phenotype, and the mean response of all cells is indicated (bold line). The CD3/CD4-mediated calcium response in mature peripheral CD4+ lymphocytes is insensitive to the receptor aggregation status. Calcium signaling was triggered by engagement of CD3 and CD4 with low (0.5 μg/ml; G) or high (5.0 μg/ml; H) streptavidin. CD4+ cells were identified within unpurified lymph node preps at the conclusion of the calcium measurement with PE-conjugated anti-CD4. Several representative traces are shown for each condition. These data are representative of at least three separate experiments for each condition.
Figure 5
Figure 5
The effect of receptor aggregation on calcium signaling. Ca2+ i signaling was induced by CD3/CD4 coaggregation in thymocytes and peripheral CD4+ lymphocytes under maximal (0.5 μg/ml) and minimal (5.0 μg/ml) aggregating conditions. The calcium responses of thymocytes are plotted together for cells expressing low (A and B), intermediate (C and D), or high (E and F) levels of CD5. Several representative traces are shown for each phenotype, and the mean response of all cells is indicated (bold line). The CD3/CD4-mediated calcium response in mature peripheral CD4+ lymphocytes is insensitive to the receptor aggregation status. Calcium signaling was triggered by engagement of CD3 and CD4 with low (0.5 μg/ml; G) or high (5.0 μg/ml; H) streptavidin. CD4+ cells were identified within unpurified lymph node preps at the conclusion of the calcium measurement with PE-conjugated anti-CD4. Several representative traces are shown for each condition. These data are representative of at least three separate experiments for each condition.
Figure 6
Figure 6
The effect of CD28 on the calcium response to CD3/CD4 aggregation. The calcium responses of CD4+CD8+ thymocytes were triggered by coengagement of CD3, CD4, (solid line), and CD28 (broken line) induced by high (1.0 μg/ml streptavidin; A) and low (5.0 μg/ml streptavidin; B) receptor aggregation. The mean response is shown, as well as the responses of individual cells (inset). This effect of CD28 on calcium was observed in three separate experiments.
Figure 6
Figure 6
The effect of CD28 on the calcium response to CD3/CD4 aggregation. The calcium responses of CD4+CD8+ thymocytes were triggered by coengagement of CD3, CD4, (solid line), and CD28 (broken line) induced by high (1.0 μg/ml streptavidin; A) and low (5.0 μg/ml streptavidin; B) receptor aggregation. The mean response is shown, as well as the responses of individual cells (inset). This effect of CD28 on calcium was observed in three separate experiments.
Figure 7
Figure 7
Correlation between calcium signaling response and thymocyte fate. Calcium signaling responses of single thymocytes after aggregation of (A) CD3 and CD4 or (B) CD3, CD4, and CD28 with streptavidin-coated microspheres (see Materials and Methods). The mean calcium response is indicated in each plot with a bold line. The thymocyte/microsphere ratio was ∼1:1, and all responding cells contacted a single microsphere. In these experiments, 1/18 cells (A) exhibited a single spike subsequent to the initial transient [Ca2+]i elevation, whereas 18/32 responding cells (B) exhibited one or more calcium spikes ≥50% of the initial peak [Ca2+]i. Arrows indicate the times when microspheres were added to the recording chamber. (C) CD3/CD4-coated microspheres induced increased CD5 expression (solid line) compared with control antibody–treated cells (broken line) but not apoptosis (D, third bar from left). (D) CD3-, CD4-, and CD28-coated microspheres induced a significant increase in the number of apoptotic cells. These maturation and calcium results are representative of at least three separate experiments with microspheres.

Similar articles

Cited by

References

    1. Ashton-Rickardt P.G., Bandeira A., Delaney J.R., Van Kaer L., Pircher H.P., Zinkernagel R.M., Tonegawa S. Evidence for a differential avidity model of T cell selection in the thymus. Cell. 1994;76:651–663. - PubMed
    1. Teh H.S., Motyka B., Teh S.J. Influence of the affinity of selecting ligands on T cell positive and negative selection and the functional maturity of the positively selected T cells. Crit. Rev. Immunol. 1997;17:399–410. - PubMed
    1. Chidgey A.P., Boyd R.L. Positive selection of low responsive, potentially autoreactive T cells induced by high avidity, non-deleting interactions. Int. Immunol. 1998;10:999–1008. - PubMed
    1. Ashton-Rickardt P.G., Tonegawa S. A differential-avidity model for T-cell selection. Immunol. Today. 1994;15:362–366. - PubMed
    1. Cibotti R., Punt J.A., Dash K.S., Sharrow S.O., Singer A. Surface molecules that drive T cell development in vitro in the absence of thymic epithelium and in the absence of lineage-specific signals. Immunity. 1997;6:245–255. - PubMed

Publication types

MeSH terms