. 1999 Nov;73(11):9348-61.
doi: 10.1128/JVI.73.11.9348-9361.1999.

Transcriptional activation by the product of open reading frame 50 of Kaposi's sarcoma-associated herpesvirus is required for lytic viral reactivation in B cells

Affiliations

Transcriptional activation by the product of open reading frame 50 of Kaposi's sarcoma-associated herpesvirus is required for lytic viral reactivation in B cells

D M Lukac et al. J Virol. 1999 Nov.

Abstract

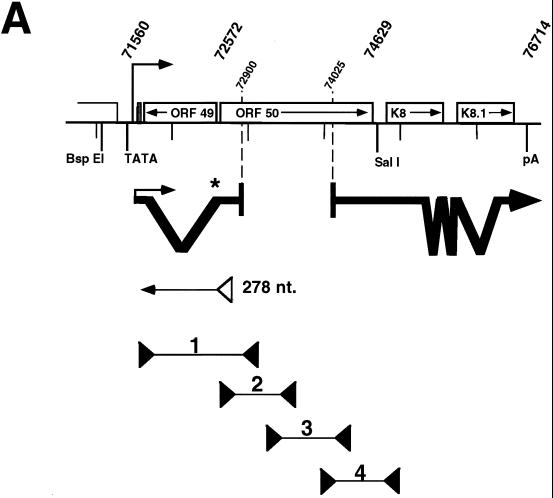
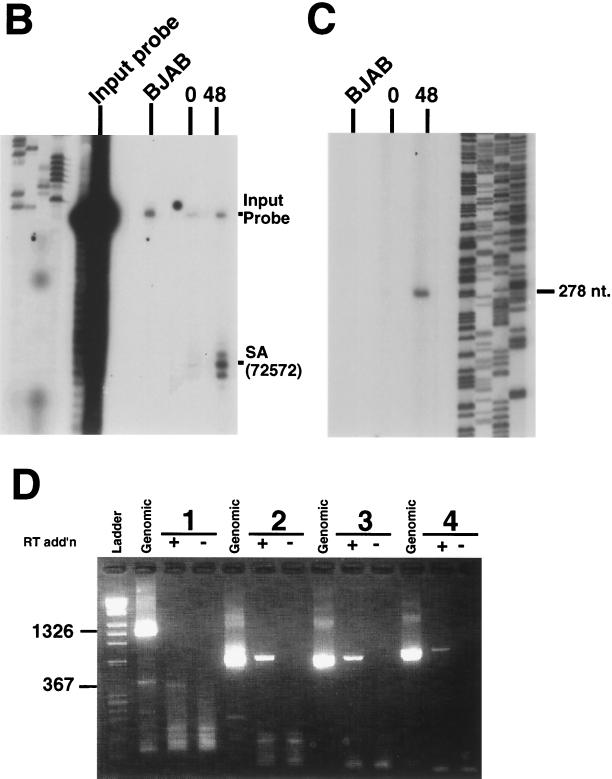
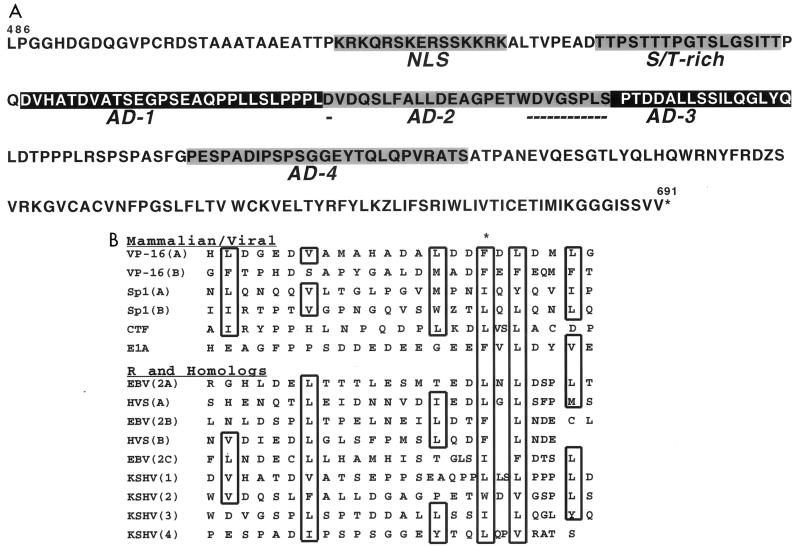
Kaposi's sarcoma (KS)-associated herpesvirus (KSHV) is a lymphotropic virus strongly linked to the development of KS, an endothelial cell neoplasm frequent in persons with AIDS. Reactivation from latency in B cells is thought to be an important antecedent to viral spread to endothelial cells during KS pathogenesis. Earlier experiments have posited a role for the transcriptional activator encoded by KSHV open reading frame 50 (ORF50) in such reactivation, since ectopic overexpression of this protein induces reactivation in latently infected B cells. Here we have explored several aspects of the expression, structure, and function of this protein bearing on this role. The ORF50 gene is expressed very early in lytic reactivation, before several other genes implicated as candidate regulatory genes in related viruses, and its expression can upregulate their promoters in transient assays. The protein is extensively phosphorylated in vivo and bears numerous sites for phosphorylation by protein kinase C, activators of which are potent stimulators of lytic induction. The C terminus of the ORF50 protein contains a domain that can strongly activate transcription when targeted to DNA; deletion of this domain generates an allele that expresses a truncated protein which retains the ability to form multimers with full-length ORF50 and functions as a dominant-negative protein. Expression of this allele in latently infected cells ablates spontaneous reactivation from latency and strikingly suppresses viral replication induced by multiple stimuli, including phorbol ester, ionomycin, and sodium butyrate. These results indicate that the ORF50 gene product plays an essential role in KSHV lytic replication and are consistent with its action as a putative molecular switch controlling the induction of virus from latency.


Figures

FIG. 1
FIG. 1
Analysis of transcription of potential lytic cycle regulatory genes in KSHV. (A) Multiple divergent transcripts are expressed in the ORF50 locus. Total RNA from untreated BCBL-1 cells (lane 0) or BCBL-1 cells induced with TPA for 12 h (lane 12) was Northern blotted and probed with single-stranded probes detecting antisense (left) or sense (right) ORF50 transcripts. Sizes of RNA molecular weight markers are shown at left. (B) Kinetics of transcript expression of potential lytic regulatory genes. Total RNA was isolated from uninduced and induced BCBL-1 cells as in panel A at the indicated times after TPA addition. Single-stranded probes were used to detect the sense ORF50 and K-bZIP transcripts, and ds probes were used to detect the other transcripts (see Materials and Methods). DBP, DNA binding protein; GAPDH, glyceraldehyde-3-phosphate dehydrogenase.
FIG. 2
FIG. 2
Detailed analysis of transcription in the ORF50 locus. (A) Summary of methods used to analyze ORF50 transcripts. The top of the figure displays a schematic of the genomic features of the ORF50 locus. Transcripts detected by 5′ RACE and cDNA library screening are indicated below the locus, to the left and right, respectively. The asterisk shows the location of the oligonucleotide probe used for S1 nuclease analysis. The open triangle immediately below the 5′ RACE product depicts the primer used in the primer extension reaction. The four lines below that represent the PCR amplification products expected from PCR performed on KSHV genomic DNA with the indicated primers (solid triangles). The rightmost primer was used as the primer for the RT reaction. (B) S1 nuclease analysis of the splice acceptor site at nt 72572. Total RNA from unstimulated BCBL-1 cells, BCBL-1 cells treated with TPA for 48 h, or BJAB cells was analyzed by S1 nuclease digestion with the oligonucleotide indicated in panel and described in Materials and Methods. Products were separated on an 8% denaturing polyacrylamide gel. The locations of the input probe and the digestion product (splice acceptor [SA]) are indicated. (C) Primer extension analysis of the start site of the ORF50 transcript. Total BCBL-1 and BJAB RNA was isolated as described above, and primer extension was performed with the primer indicated in panel A and described in Materials and Methods. Products were visualized as for panel B. A sequencing ladder at the right provides a size reference. (D) RT PCR analysis of ORF50 cDNA. Total RNA was isolated as described above, half was reverse transcribed, and the other half was incubated with the RT primer in the absence of RT. The resulting reactions were divided among four PCRs with the four primer pairs depicted in panel A. A genomic ORF50 clone was used as a control in similar PCRs (Genomic). Products were visualized by agarose gel electrophoresis and ethidium bromide staining. Numbers at the top indicate the primer pairs; +, RT addition; −, RT omission. The ladder is a mixture of phage lambda DNA HindIII and phage φX174 DNA HaeIII fragments. The molecular sizes given at left refer to the genomic and cDNA amplification products generated with primer pair 1.
FIG. 2
FIG. 2
Detailed analysis of transcription in the ORF50 locus. (A) Summary of methods used to analyze ORF50 transcripts. The top of the figure displays a schematic of the genomic features of the ORF50 locus. Transcripts detected by 5′ RACE and cDNA library screening are indicated below the locus, to the left and right, respectively. The asterisk shows the location of the oligonucleotide probe used for S1 nuclease analysis. The open triangle immediately below the 5′ RACE product depicts the primer used in the primer extension reaction. The four lines below that represent the PCR amplification products expected from PCR performed on KSHV genomic DNA with the indicated primers (solid triangles). The rightmost primer was used as the primer for the RT reaction. (B) S1 nuclease analysis of the splice acceptor site at nt 72572. Total RNA from unstimulated BCBL-1 cells, BCBL-1 cells treated with TPA for 48 h, or BJAB cells was analyzed by S1 nuclease digestion with the oligonucleotide indicated in panel and described in Materials and Methods. Products were separated on an 8% denaturing polyacrylamide gel. The locations of the input probe and the digestion product (splice acceptor [SA]) are indicated. (C) Primer extension analysis of the start site of the ORF50 transcript. Total BCBL-1 and BJAB RNA was isolated as described above, and primer extension was performed with the primer indicated in panel A and described in Materials and Methods. Products were visualized as for panel B. A sequencing ladder at the right provides a size reference. (D) RT PCR analysis of ORF50 cDNA. Total RNA was isolated as described above, half was reverse transcribed, and the other half was incubated with the RT primer in the absence of RT. The resulting reactions were divided among four PCRs with the four primer pairs depicted in panel A. A genomic ORF50 clone was used as a control in similar PCRs (Genomic). Products were visualized by agarose gel electrophoresis and ethidium bromide staining. Numbers at the top indicate the primer pairs; +, RT addition; −, RT omission. The ladder is a mixture of phage lambda DNA HindIII and phage φX174 DNA HaeIII fragments. The molecular sizes given at left refer to the genomic and cDNA amplification products generated with primer pair 1.
FIG. 3
FIG. 3
The ORF50 polypeptide is highly phosphorylated in mammalian cells. (A) Transfected cells. Cos-7 cells were transfected with pcDNA3 (Vector) or pcDNA3-FLg50 (ORF50), and whole-cell extracts were isolated with 10s buffer at 48 h posttransfection (see Materials and Methods). Extracts were incubated with (+) or without (−) CIP (see Materials and Methods). The resulting products were separated on SDS–8% polyacrylamide gels and detected by Western blotting as described in Materials and Methods. The leftmost lane contains the product of IVT-T of ORF50 in RRL. The migration of protein molecular weight standards is indicated at the left. (B) BCBL-1 cells. BCBL-1 or BJAB cells were treated with TPA for 24 h or left untreated and harvested in 10s buffer as described for panel A. Total protein in each extract was quantitated by Bradford analysis, and equal amounts of protein were analyzed as described for panel A. The ORF50 RRL product and extracts from vector- or pcDNA3-FLg50-transfected Cos-7 cells were coelectrophoresed as size references. The migration of protein molecular weight markers is indicated at the left.
FIG. 4
FIG. 4
Transient transcriptional activation of KSHV promoters by ORF50. (A) ORF50 directly transactivates the promoters of ORF57 and K-bZIP in a dose-dependent fashion. CV-1 cells were transfected with the indicated reporter vectors and increasing amounts of pcDNA3-FLgORF50 (see Materials and Methods). Empty pcDNA3 was used to normalize total DNA. Cell extracts were analyzed for luciferase and β-galactosidase activities 42 to 48 h posttransfection (see Materials and Methods). (B) ORF50 transactivates DE promoters in the human cell lines BJAB and SLK. The indicated promoter constructs were electroporated or transfected into BJAB or SLK cells, together with various amounts of ORF50, as described in Materials and Methods. Cell extracts were analyzed as described for panel A. The maximal amount of activation of each promoter is shown. Error bars show standard deviations.
FIG. 5
FIG. 5
Analysis of the transcriptional activation domain of ORF50. (A) Gal4-ORF50 fusions. The top of the figure shows a schematic of the ORF50 polypeptide. Putative domains are indicated as follows: LZ, leucine zipper; ST, serine/threonine-rich region; AD, activation domain. Below this schematic are representations of the four ORF50 variants fused N-terminally to the DNA binding domain of Gal4. Amino acid numbers indicate the end of each truncation. (B) ORF50 contains a potent carboxy-terminal activation domain. CV-1 cells were transfected with 3 μg of pGal4-tk-luc (see the text) and 1 or 3 μg of each of the indicated plasmids. Cell extracts were analyzed as described in the legend to Fig. 4. All activation levels were normalized to that of pSG0 (Gal4 alone), here given as 1×. Error bars show standard deviations. (C) The ORF50 activation domain functions in B cells and spindle cells. BJAB and SLK cells were transfected and extracts were analyzed as described in the legend to Fig. 4. Error bars show standard deviations. (D) Expression of Gal4 fusion proteins in CV-1 cells. CV-1 cells were transfected with the indicated vectors, and cells were harvested and extracts were analyzed as described in the legend to Fig. 3. Positions of molecular weight markers are indicated.
FIG. 6
FIG. 6
The ORF50 activation domain shows sequence conservation with numerous cellular and viral transcription factors. (A) Sequence of aa 486 to 691 of ORF50, representing the peptide fused to the Gal4 DNA binding domain in plasmid pSG0-C50 (Fig. 5A). The putative NLS, a serine/threonine-rich region (S/T-rich), and four conserved repeats (AD-1 to AD-4) are indicated. Underlining represent regions of overlap between adjacent conserved repeats. The asterisk indicates the location of the stop codon. (B) Alignment of the four conserved repeats of the ORF50 activation domain with similar domains found in cellular (Sp1 and CTF) and viral (VP-16, HSV VP16; E1A, adenovirus E1A; HVS, herpesvirus saimiri ORF50) transcription factors. R, genetic designation for EBV ORF50 homolog. Conserved bulky hydrophobic amino acids are boxed. A, B, 2A, 2B, and 2C designate independent domains of each protein (24). The asterisk indicates F442 in VP16 domain A, discussed in the text. (Adapted from reference with permission.)
FIG. 7
FIG. 7
Deletion of the ORF50 activation domain creates a dominant-negative transcriptional mutant. (A) ORF50ΔSTAD inhibits transactivation of the ORF57 promoter by wild-type ORF50. CV-1 cells were transfected with ORF57-GL3 (P57) and 0 to 12 μg of pCMV-myc-nuc-50ΔSTAD alone (left ordinate; ○) or with 1 μg of pcDNA3-FLg50 (left ordinate; □). Alternatively, 5 μg of pCMV-βgal was transfected with increasing amounts of ORF50ΔSTAD (right ordinate; ×). Empty pcDNA3 was included to normalize total DNA in each transfection. Extracts were prepared and analyzed as described in the legend to Fig. 4. Error bars show standard deviations. (B) ORF50ΔSTAD is expressed in Cos-7 cells. Cos-7 cells were transfected with empty pcDNA3, pCMV-myc-nuc-ΔSTAD, or pcDNA3-FLg50, harvested, and analyzed as described in the legend to Fig. 5D. The numbers at the left indicate the positions of protein molecular weight markers. (C) ORF50ΔSTAD heterodimerizes with wild-type ORF50 in transfected Cos-7 cells. Cos-7 cells were transfected with the indicated plasmids; total DNA was normalized to 10 μg with vector plasmid in all transfections. Extracts were prepared and incubated with anti-V5 antibody (see Materials and Methods). Immunoprecipitated proteins were analyzed by SDS-PAGE, Western blotted, and probed with anti-ORF50 serum. HC, migration of the heavy chain of the antibody in each lane. Input lanes contained one-eighth the volume of total extract before immunoprecipitation. Molecular weight markers are shown at the left. (D) ORF50ΔSTAD heterodimerizes with wild-type ORF50 in RRL. RRL were programmed with the indicated plasmids, and translated products were labelled by including l-[35S]methionine in the reactions. All reactions were programmed with equal amounts of DNA. Lysates were incubated with anti-ORF50 serum (see Materials and Methods), and immunoprecipitated proteins were analyzed by SDS-PAGE and autoradiography of the fixed, amplified, and dried gel. Input lanes contained 1/15th the volume of total lysate before immunoprecipitation. Molecular weight markers are shown at the left.
FIG. 8
FIG. 8
Transactivation by ORF50 is necessary for lytic reactivation. BCBL-1 cells were electroporated with 20 μg of activator or empty vector and 4 μg of a vector expressing hepatitis delta antigen. Cells either were left untreated or were treated with TPA (A) or sodium butyrate (nBA) (B) 15 to 18 h postelectroporation. Successfully transfected cells, identified by positive staining for hepatitis delta antigen, were scored 72 h (A) or 36 h (B) postelectroporation for expression of ORF59 and K8.1. At least 1,000 transfected cells were counted for each electroporation. The percentage of transfected cells expressing the respective KSHV lytic marker is indicated above each bar. The bars indicate the fold induction of the lytic markers relative to that in cells electroporated with the control pcDNA3 vector in the absence of TPA.

Similar articles

Cited by

References

    1. Ambroziak J, Blackbourn D, Herndier B, Glogan R, Gullet J, McDonald A, Lennette E, Levy J. Herpesvirus-like sequences in HIV-infected and uninfected Kaposi’s sarcoma patients. Science. 1995;268:582–583. - PubMed
    1. Arvanitakis L, Geras-Raaka E, Varma A, Gershengorn M C, Cesarman E. Human herpesvirus KSHV encodes a constitutively active G-protein-coupled receptor linked to cell proliferation. Nature. 1997;385:347–350. - PubMed
    1. Ausubel F M, Brent R, Kingston R E, Moore D D, Seidman J G, Smith J A, Struhl K. Current protocols in molecular biology. Vol. 2. New York, N.Y: John Wiley & Sons, Inc.; 1997.
    1. Bais C, Santomasso B, Coso O, Arvanitakis L, Raaka E G, Gutkind J S, Asch A S, Cesarman E, Gershengorn M C, Mesri E A. G-protein-coupled receptor of Kaposi’s sarcoma-associated herpesvirus is a viral oncogene and angiogenesis activator. Nature. 1998;391:86–89. - PubMed
    1. Barber J R, Verma I M. Modification of fos proteins: phosphorylation of c-fos, but not v-fos, is stimulated by 12-tetradecanoyl-phorbol-13-acetate and serum. Mol Cell Biol. 1987;7:2201–2211. - PMC - PubMed

Publication types

MeSH terms

LinkOut - more resources