. 1999 Nov;73(11):9404-12.
doi: 10.1128/JVI.73.11.9404-9412.1999.

Evolution of envelope sequences of human immunodeficiency virus type 1 in cellular reservoirs in the setting of potent antiviral therapy

Affiliations

Evolution of envelope sequences of human immunodeficiency virus type 1 in cellular reservoirs in the setting of potent antiviral therapy

H F Günthard et al. J Virol. 1999 Nov.

Abstract

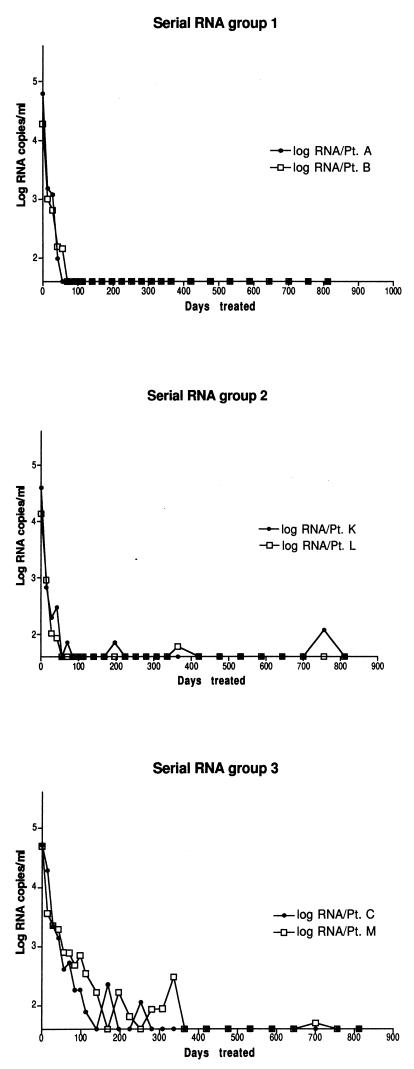
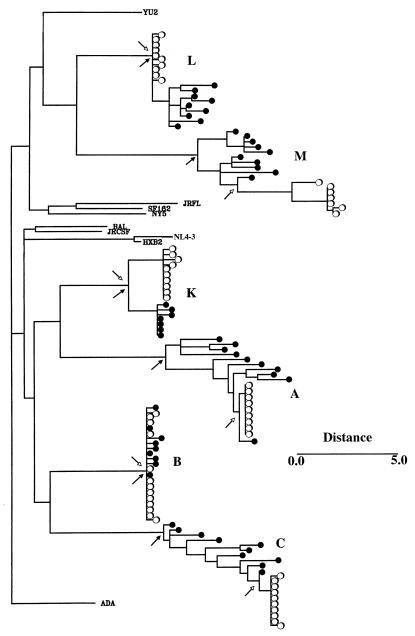
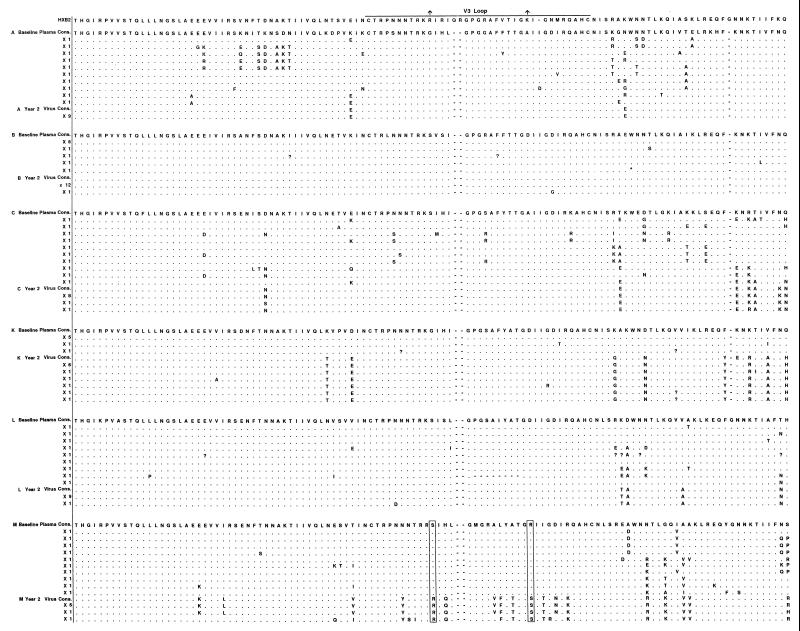
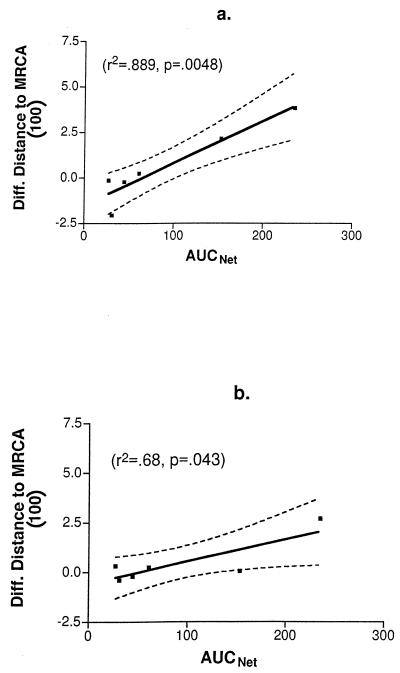
In human immunodeficiency virus (HIV)-infected patients treated with potent antiretroviral therapy, the persistence of latently infected cells may reflect the long decay half-life of this cellular reservoir or ongoing viral replication at low levels with continuous replenishment of the population or both. To address these possibilities, sequences encompassing the C2 and V3 domains of HIV-1 env were analyzed from virus present in baseline plasma and from viral isolates obtained after 2 years of suppressive therapy in six patients. The presence of sequence changes consistent with evolution was demonstrated for three subjects and correlated with less complete suppression of viral replication, as indicated by the rapidity of the initial virus load decline or the intermittent reappearance of even low levels of detectable viremia. Together, these results provide evidence for ongoing replication. In the remaining three patients, virus recovered after 2 years of therapy was either genotypically contemporary with or ancestral to virus present in plasma 2 years before, indicating that virus recovery had indeed resulted from activation of latently infected cells.


Figures

FIG. 1
FIG. 1
Log RNA copies/ml in serum or plasma plotted against days under indinavir, zidovudine, and lamivudine combination therapy. The baseline for the y axis is the limit of detection of the Roche ultrasensitive assay (1.6 log copies/ml). The top panel demonstrates the response of two patients (Pt.) with steep initial declines in viral load (A and B). The middle panel shows two patients with steep initial declines followed by transient reappearance of low levels of detectable viral RNA (K and L). The bottom panel shows two patients with slow initial responses (C and M) and, in one patient (M), intermittent transient reappearance of low levels of viral RNA in the blood.
FIG. 2
FIG. 2
Maximum-likelihood phylogenetic tree displaying relationships of sequences of clones derived from plasma collected at the start of therapy (time zero) and from viral isolates obtained approximately 2 years into therapy. The letters adjacent to individual sequence clusters identify the patient source of the sequences. In every case, the sequences from an individual patient clustered with sequences from the same patient and with no others. Sequences of prototypic T-lymphocytotrophic and macrophage-tropic viruses are denoted by the respective reference names (NL4-3, SF162, etc.). Sequences derived from baseline plasma are represented by solid circles. Sequences derived from viral isolates are indicated by open circles. The arrows with solid arrowheads identify nodes representing the MRCA identified for all plasma and viral isolate sequences from each patient. The arrows with open arrowheads identify nodes representing the MRCA for the viral isolate cluster and the plasma viral sequence(s) nearest it. Horizontal branch lengths are scaled and correspond approximately to the percent nucleotide differences between sequences and nodes. Sequences whose branch lengths were not significantly different from zero are shown with collapsed branches.
FIG. 3
FIG. 3
Predicted protein sequences. All letter designations for amino acids (AA) conform to the standard International Union of Pure and Applied Chemistry code. The HXB2 reference sequence (Los Alamos National Laboratory) is given at the top with the region corresponding to the V3 loop marked by a heavy line and residues 306 and 322 identified with arrows. Subject and source are identified in the first column, with the consensus sequence in plasma at baseline given in its entirety (based on the most frequently occurring AA at each position, or when two AA occurred with equal frequency from the same source, the AA corresponding to the HXB2 reference at the same position). Shown next are clonal sequences from year 0 plasma, followed by the consensus sequence from the year 2 viral isolates and the clonal sequences from year 2 viral isolates. These sequences are shown with the following abbreviations in reference to the baseline plasma consensus sequence for the same patient: period, identity with the plasma consensus; dash, gap inserted to maintain alignment of all sequences shown; question mark, unresolved AA position; asterisk, nonsense mutation. Replacements are indicated by the appropriate code letter. The frequency with which a particular clonal sequence was encountered is shown in the first column adjacent to each sequence. For patient M, residues 306 and 322 have been boxed to highlight the substitutions noted.
FIG. 4
FIG. 4
Regression analysis of the AUCNet and the differences in mean distances from plasma virus and virus isolates to the MRCA with inclusion of all plasma sequences calculated with summation of branch lengths (a) or by direct calculation of distance from sequences (b). The solid line represents the line of fit. The broken lines represent confidence curves for fit.

References

    1. Adachi A, Gendelman H E, Koenig S, Folks T, Willey R, Rabson A, Martin M A. Production of acquired immunodeficiency syndrome-associated retrovirus in human and nonhuman cells transfected with an infectious molecular clone. J Virol. 1986;59:284–291. - PMC - PubMed
    1. Balfe P, Simmonds P, Ludlam C A, Bishop J O, Leigh-Brown A J. Concurrent evolution of human immunodeficiency virus type 1 in patients infected from the same source: rate of sequence change and low frequency of inactivating mutations. J Virol. 1990;64:6221–6233. - PMC - PubMed
    1. Cavert W, Notermans D W, Staskus K, Wietgrefe S, Zupancic M, Gebhard K, Henry K, Zhang Z Q, Mills R, McDade H, Goudsmit J, Danner S A, Haase A T. Kinetics of response in lymphoid tissues to antiretroviral therapy of HIV-1 infection. Science. 1997;276:960–964. - PubMed
    1. Chun T W, Stuyver L, Mizell S B, Ehler L A, Mican J M, Baseler M, Lloyd A L, Nowak M A, Fauci A S. Presence of an inducible HIV latent reservoir during highly active antiretroviral therapy. Proc Natl Acad Sci USA. 1997;94:13193–13197. - PMC - PubMed
    1. De Jong J-J, Goudsmit J, Keulen W, Klaver B, Krone W, Tersmette M, de Ronde A. Human immunodeficiency virus type 1 clones chimeric for the envelope V3 domain differ in syncytium formation and replication capacity. J Virol. 1992;66:757–765. - PMC - PubMed

Publication types

MeSH terms

Associated data

LinkOut - more resources