. 1999 Oct 1;520 Pt 1(Pt 1):165-76.
doi: 10.1111/j.1469-7793.1999.00165.x.

Direct actions of nitric oxide on rat neurohypophysial K+ channels

Affiliations

Direct actions of nitric oxide on rat neurohypophysial K+ channels

G P Ahern et al. J Physiol. .

Abstract

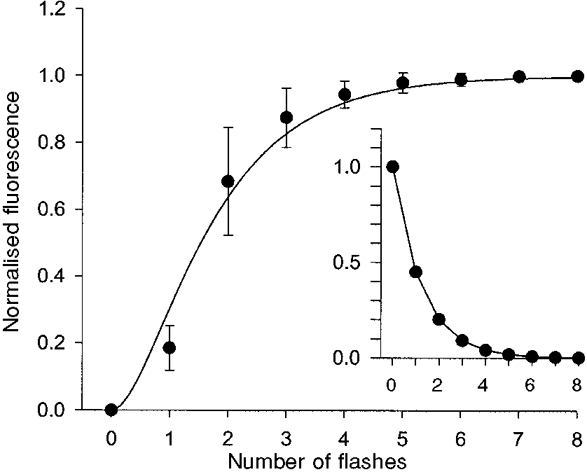
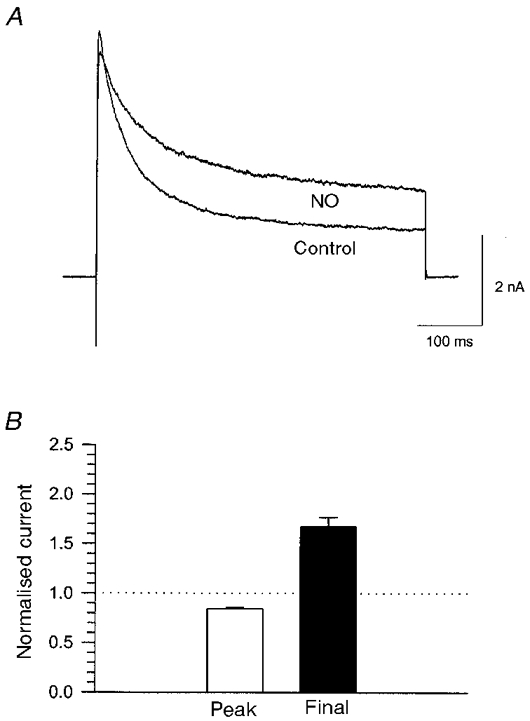
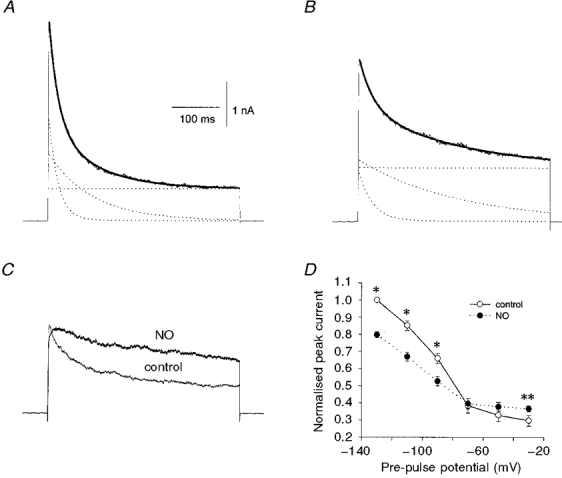
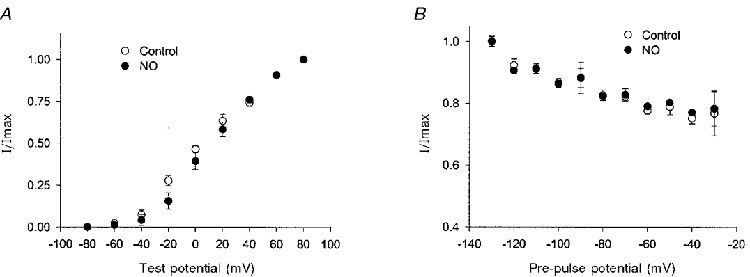
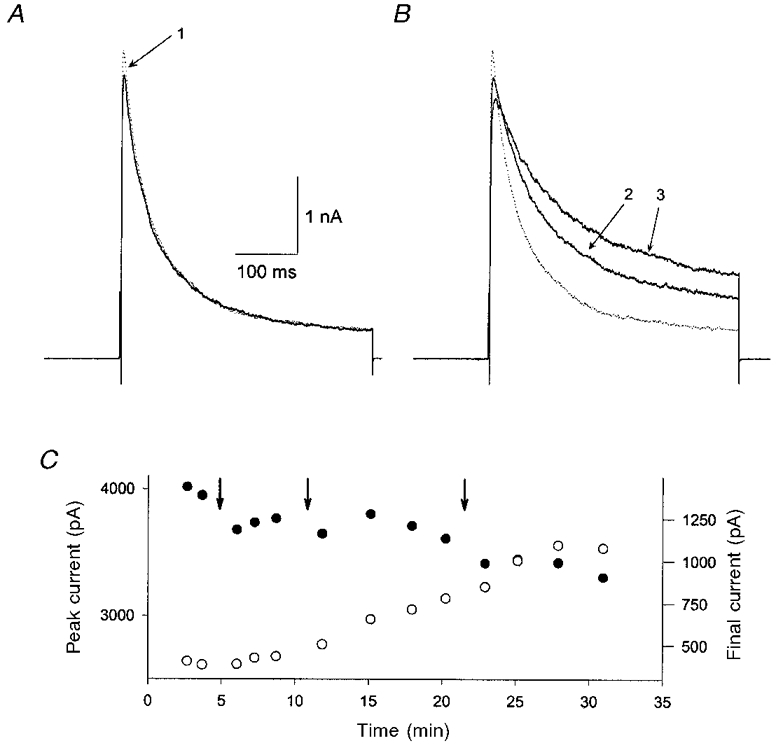
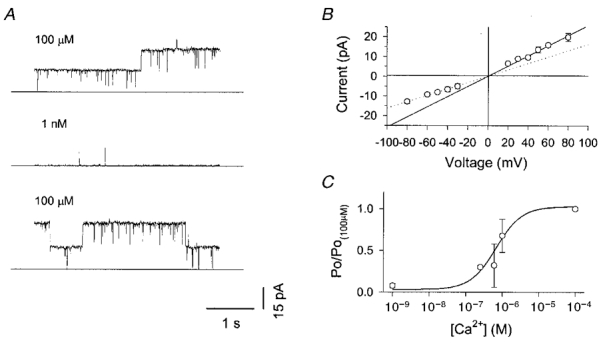
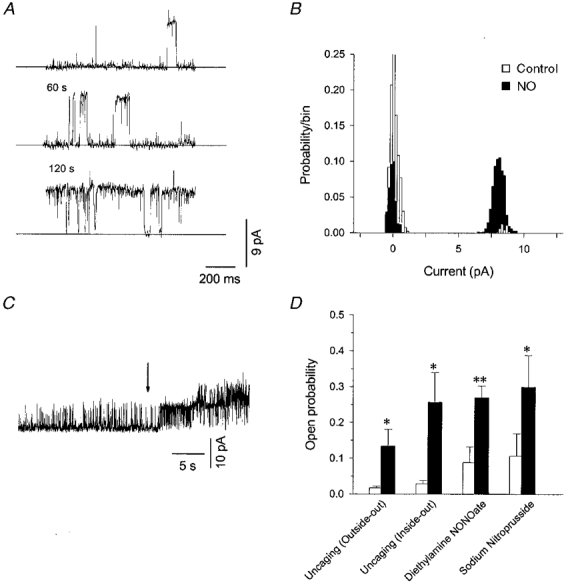
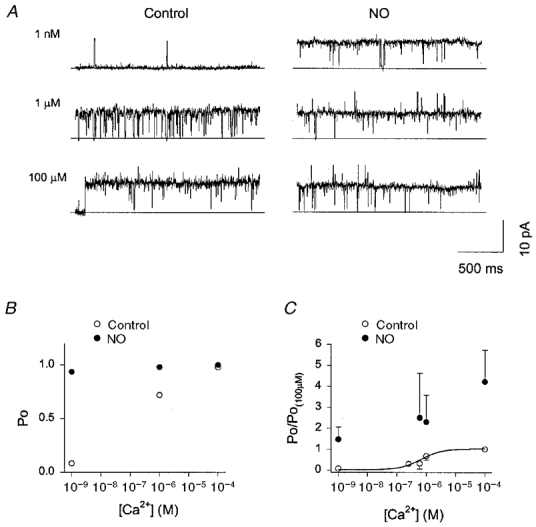
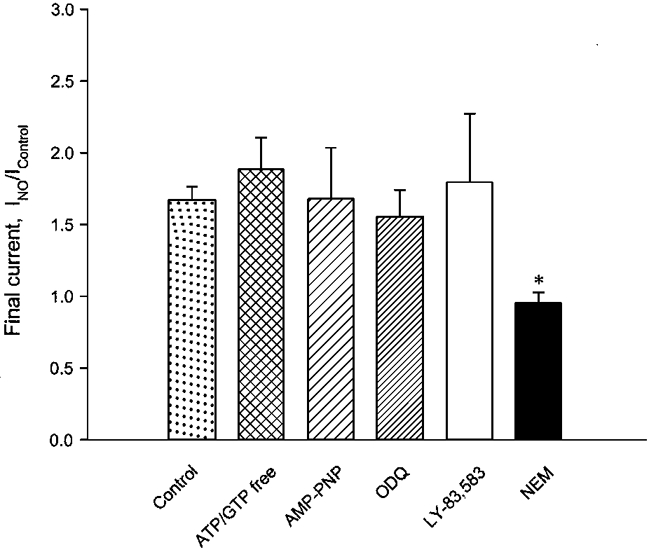
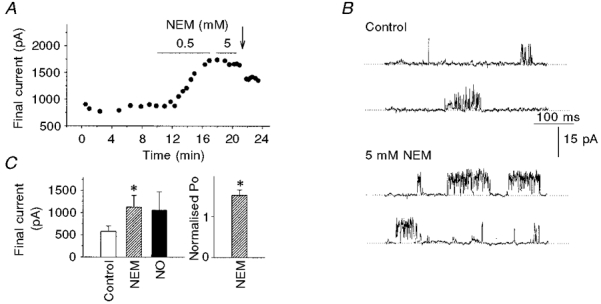
1. Nitric oxide (NO) has been shown to modulate neuropeptide secretion from the posterior pituitary. Here we show that NO activates large-conductance Ca2+-activated K+ (BK) channels in posterior pituitary nerve terminals. 2. NO, generated either by the photolysis of caged-NO or with chemical donors, irreversibly enhanced the component of whole-terminal K+ current due to BK channels and increased the activity of BK channels in excised patches. NO also inhibited the transient A-current. The time courses of these effects on K+ current were very different; activation of BK channels developed slowly over several minutes whereas inhibition of A-current immediately followed NO uncaging. 3. Activation of BK channels by NO occurred in the presence of guanylyl cyclase inhibitors and after removal of ATP or GTP from the pipette solution, suggesting a cGMP-independent signalling pathway. 4. The sulfhydryl alkylating agent N-ethyl maleimide (NEM) increased BK channel activity. Pretreatment with NEM occluded NO activation. 5. NO activation of BK channels occurred independently of voltage and cytoplasmic Ca2+ concentration. In addition, NO removed the strict Ca2+ requirement for channel activation, rendering channels highly active even at nanomolar Ca2+ levels. 6. These results suggest that NO, or a reactive nitrogen byproduct, chemically modifies nerve terminal BK channels or a closely associated protein and thereby produces an increase in channel activity. Such activation is likely to inhibit impulse activity in posterior pituitary nerve terminals and this may explain the inhibitory action of NO on secretion.


Figures

Figure 1
Figure 1. Photolytic efficiency of 75 W Xenon lamp
Normalised nerve terminal fluorescence (means ±s.d.) from 9 nerve terminals (loaded with 85 μm caged-fluorescein) versus the number of light flashes. The continuous curve shows the best fit to eqn (1) (see Methods) with a Δ value of 1.25. The inset shows a plot of exp(-n/Δ), or the fraction of unphotolysed caging groups remaining after each light flash. Thus each flash liberates 55 % of the caging groups. A calculation in Methods based on this result suggests that each flash will photolyse 2 % of the caged-NO.
Figure 2
Figure 2. NO modulation of whole-terminal K+ current
A, whole-terminal K+ current evoked by a 500 ms pulse from −80 to +50 mV before and approximately 10 min after uncaging of NO with 5 light flashes in 3 s (raising [NO] to < = 400 μm). NO increased the current at the end of the pulse by 82 % and caused a small reduction of 8 % in the peak current. B, mean (±s.e.m.) changes in peak and final current from 25 terminals, expressed as a fraction of control. In each terminal NO was released with 5 successive light flashes as in A. Current was recorded 5–10 min later to allow for the slow time course of NO action (see Fig. 3).
Figure 3
Figure 3. Effect of NO on the different kinetic components of whole-terminal K+ current
A, whole-terminal K+ current evoked by a 400 ms depolarisation from −120 to +50 mV. The decay in current was well fitted with a double exponential function (continuous curve) of the form: The three kinetic components were plotted separately (dotted lines); A0 (sustained component) = 721 pA; A1 (rapidly inactivating component) = 2270 pA and τ1 = 9 ms; A2 (slowly inactivating component) = 1485 pA and τ2 = 90 ms. B, K+ current from the same terminal as in A, after uncaging of NO. A0 increased to 1199 pA, A1 decreased to 1074 pA and A2 was essentially unchanged (1368 pA). τ1 and τ2 increased to 28 and 205 ms, respectively. C, superimposed K+ currents before and after NO, with K+ current evoked following a 400 ms pre-pulse to −70 mV. Note that this pre-pulse removed most of the rapidly decaying A-current. NO did not affect the peak current evoked from this potential, unlike depolarisations from −120 mV. D, plot of normalised peak current versus pre-pulse potential. Data are plotted as means ±s.e.m. for 6 experiments (*P < 0.01, **P < 0.05). The inhibition of peak current by NO was attenuated by depolarising pre-pulses because this eliminated most of the A-current (see text).
Figure 8
Figure 8. NO activation of final K+ current is independent of voltage
The final K+ current reflects BK current with essentially no contribution from A-current. A, amplitude of final K+ current following 500 ms voltage steps from −120 mV to various test potentials, control (n = 3 terminals), and after (n = 5 terminals) NO (< = 400 μm). B, plot of final current elicited by a 500 ms pulse to +50 mV versus pre-pulse potential, control (n = 6 terminals), and after (n = 4 terminals) NO. In A and B, current amplitudes were normalised to the maximum value.
Figure 4
Figure 4. Time course of NO modification of K+ current
A and B, whole-terminal K+ currents evoked by a 400 ms depolarisation to +50 mV from a pre-pulse potential of −120 mV. A shows the response immediately after the first light flash (1) used to raise [NO] to 80 μm. B shows the current after a second (2) and third (3) light flash. C, plot showing the amplitudes of the peak (•) and final (○) K+ currents versus time for the same experiment shown in A. Arrows indicate illumination with a single flash. Note that the final current increased slowly and continued to rise for about 10 min after the third light flash whereas the peak current was inhibited immediately after the first light flash.
Figure 5
Figure 5. Single channel properties of nerve terminal BK channels
A, Ca2+-sensitive BK channel activity in an inside-out patch held at +60 mV. The free [Ca2+] in the bath solution was sequentially changed between 100 μm and 1 nM as indicated, by perfusion with Ca2+-EGTA-buffered solutions. B, single channel current-voltage relationship from 10 patches with 150 mm/140 mm (bath/pipette) K+ and > 1 μm cytoplasmic free Ca2+. The channels exhibited modest outward rectification. Slope conductances at negative and positive potentials were 162 and 257 pS, respectively. C, normalised open probability versus free [Ca2+] obtained from 9 patches. The continuous curve represents the best fit to a Hill equation with a KA of 680 nM and a Hill coefficient of 1.2.
Figure 6
Figure 6. NO and NO donors activate single BK channels in excised patches
A, activity from a single BK channel in an excised (inside-out) patch before, and 60 and 120 s after uncaging of NO (< = 240 μm). The holding potential was +30 mV and free [Ca2+] was nominally 1 nM. B, amplitude histogram for the same channel as in A showing that the NO-induced modification did not affect the open channel amplitude (≈8 pA). C, continuous record of activity from an excised patch containing at least two BK channels showing that one channel with a high Po was activated shortly after uncaging (arrow). The patch was held at +30 mV and the bath contained 100 μm free Ca2+. D, summary of the effects of caged-NO and NO donors on BK channel activity (▪); *P < 0.05, **P < 0.01, compared with control (□). The differences in control Po are due to the different [Ca2+] used. The free [Ca2+] on the cytosolic face of the membrane was 1 and 160 nM for caged-NO and donor experiments, respectively. The full ionic composition is given in the Methods.
Figure 7
Figure 7. NO activation of BK channels is Ca2+ independent
A, activity from an inside-out patch with varying bath [Ca2+], before (Control) and after uncaging of NO. The majority of activity was due to a single channel which exhibited a strong Ca2+ dependence under control conditions. Occasional superimposed activity from a second channel can be seen at 100 μm Ca2+. After NO uncaging the first channel was highly active at all [Ca2+]. B, Poversus[Ca2+] plot for the main channel in A showing that NO removed the Ca2+ dependence of activity and increased Po to close to unity. C, normalised Poversus[Ca2+] from 9 inside-out patches showing that NO increased activity at all [Ca2+]. Note that, unlike the single channel shown in A and B, NO increased channel activity at 100 μm Ca2+. This reflected both an increase in the number of active channels and an increase in Po (which was less than unity under control conditions).
Figure 9
Figure 9. NO activation is independent of cGMP and phosphorylation
Mean (±s.e.m.) fractional increase in final K+ current after NO uncaging under various conditions: control (25 terminals; from Fig. 2B), omission of ATP and GTP from the pipette solution (7 terminals), replacement of ATP with the non-hydrolysable analogue AMP-PNP (4 mm, 2 terminals), inclusion of the specific guanylyl cyclase inhibitors ODQ (16 μm, 4 terminals) or LY-83,583 (17 μm, 4 terminals) in the pipette solution, and bath application or inclusion of NEM (0.5–5 mm, 6 terminals) in the pipette solution. Data are the maximal response obtained after photorelease of < = 400 μm NO. NEM treatment alone prevented NO activation (*P < 0.001, compared with control). Note that the control measurement in the NEM experiment is current after NEM enhancement (see Fig. 10), and this result means that NO caused no further enhancement beyond that caused by NEM.
Figure 10
Figure 10. NEM increases whole-terminal K+ current and single BK channel activity
A, plot of final current versus time from a single experiment. Perfusion of 0.5 mm NEM into the bath solution produced a nearly 2-fold increase in current. No further activation was observed with 5 mm NEM, suggesting that the effect was already saturated. NEM also prevented subsequent activation by NO; in this case photolysis of caged-NO (arrow) reduced the final K+ current. B, single channel activity of a BK channel in an inside-out patch held at −60 mV. NEM (5 mm) increased Po from 0.16 to 0.26. C, left panel: summary of effects of bath perfusion of NEM (0.5–5 mm). NEM increased the final current from 580 ± 120 to 1120 ± 270 pA (4 terminals, *P < 0.05, compared with Control). In two of these experiments, further NO treatment had little effect. Right panel, mean Po (normalised to control) for 3 patches after treatment with 5 mm NEM (*P < 0.05, compared with control).

References

    1. Archer SL, Huang JM, Hampl V, Nelson DP, Shultz PJ, Weir EK. Nitric oxide and cGMP cause vasorelaxation by activation of a charybdotoxin-sensitive K channel by cGMP-dependent protein kinase. Proceedings of the National Academy of Sciences of the USA. 1994;91:7583–7587. - PMC - PubMed
    1. Arnelle DR, Stamler JS. NO+, NO, and NO− donation by S-nitrosothiols: implications for regulation of physiological functions by S-nitrosylation and acceleration of disulfide formation. Archives of Biochemistry and Biophysics. 1995;318:279–285. - PubMed
    1. Bettache N, Carter T, Corrie JE, Ogden D, Trentham DR. Photolabile donors of nitric oxide: ruthenium nitrosyl chlorides as caged nitric oxide. Methods in Enzymology. 1996;268:266–281. - PubMed
    1. Bielefeldt K, Jackson MB. A calcium-activated potassium channel causes frequency-dependent action-potential failures in a mammalian nerve terminal. Journal of Neurophysiology. 1993;70:284–298. - PubMed
    1. Bielefeldt K, Jackson MB. Phosphorylation and dephosphorylation modulate a Ca2+-activated K+ channel in rat peptidergic nerve terminals. The Journal of Physiology. 1994;475:241–254. - PMC - PubMed

Publication types

MeSH terms

LinkOut - more resources