. 1999 Oct 1;520 Pt 1(Pt 1):187-201.
doi: 10.1111/j.1469-7793.1999.00187.x.

The role of Ca2+ feedback in shaping InsP3-evoked Ca2+ signals in mouse pancreatic acinar cells

Affiliations

The role of Ca2+ feedback in shaping InsP3-evoked Ca2+ signals in mouse pancreatic acinar cells

J F Kidd et al. J Physiol. .

Abstract

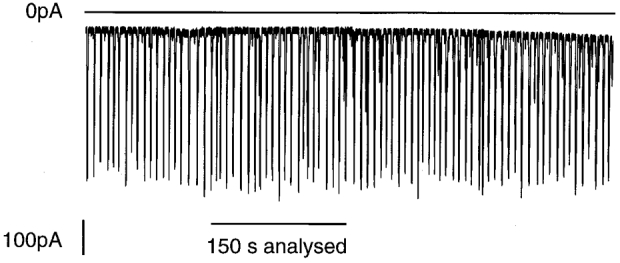
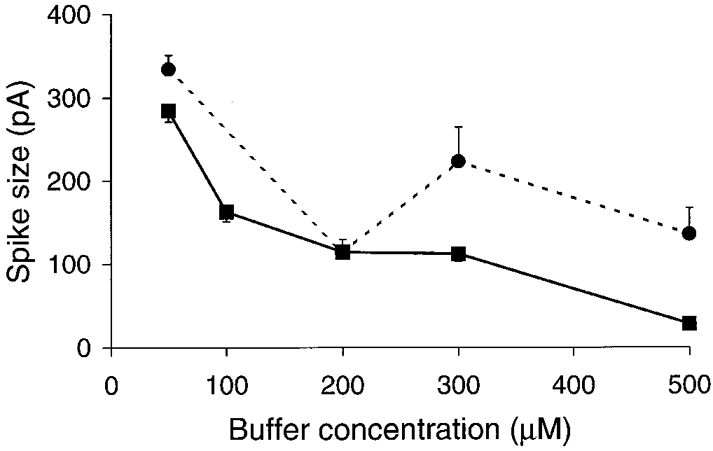
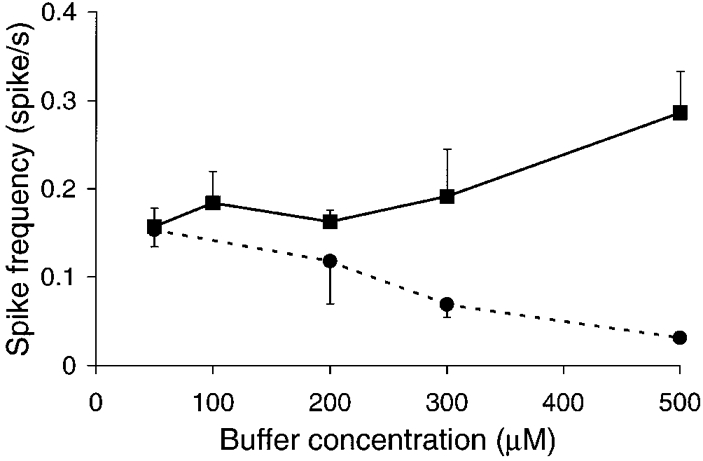
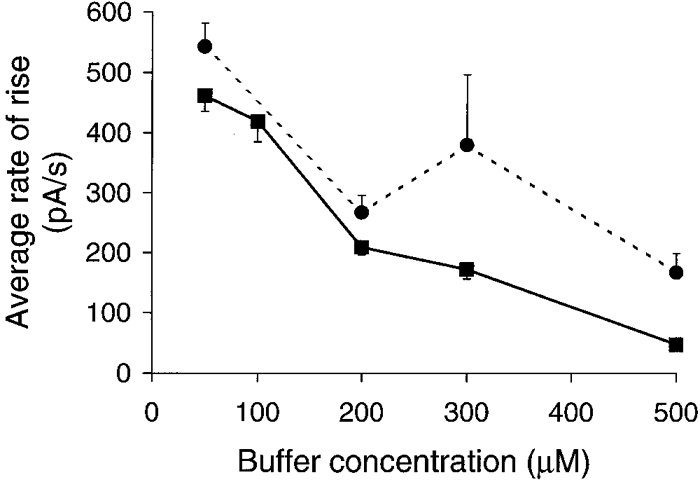
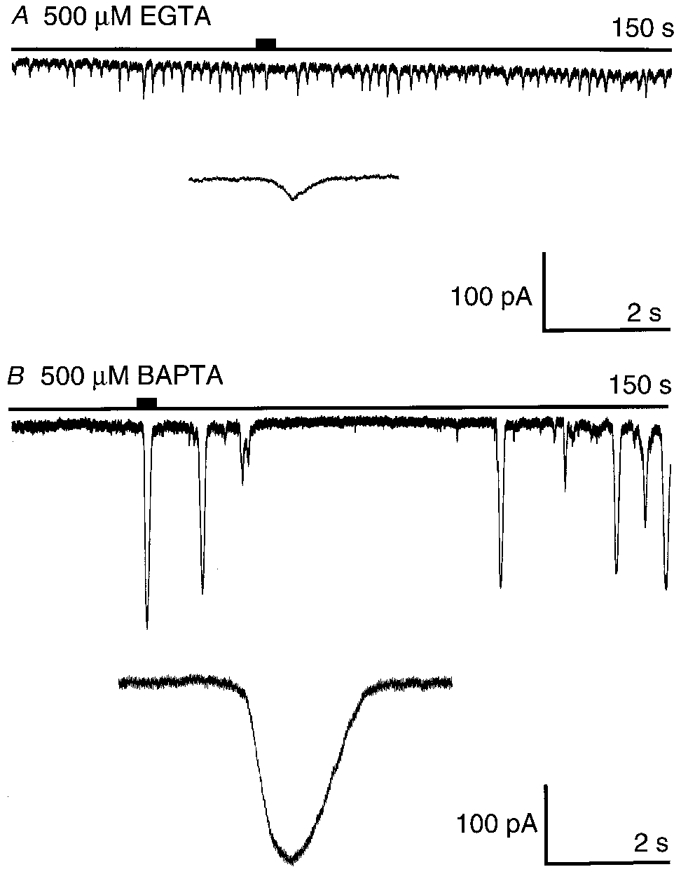
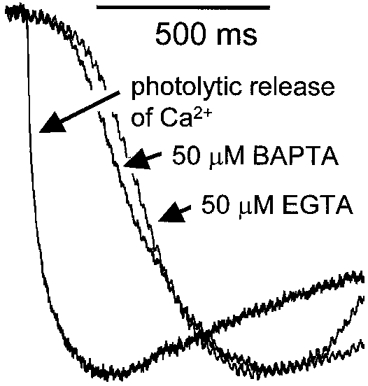
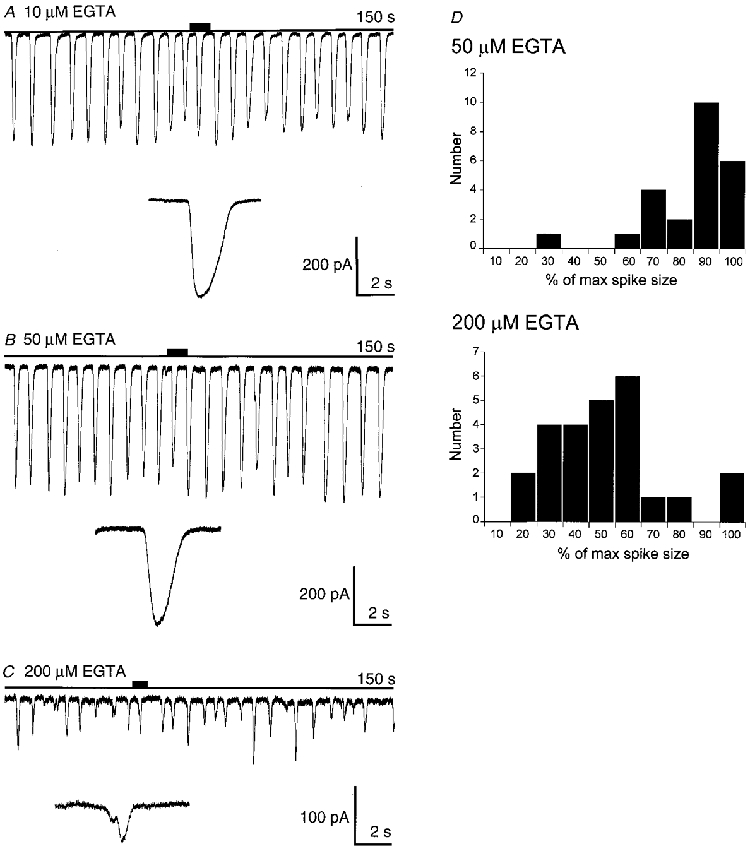
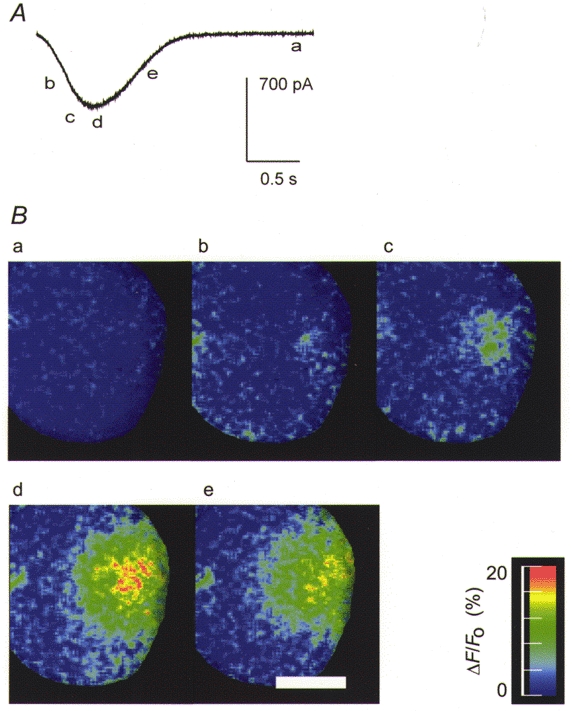
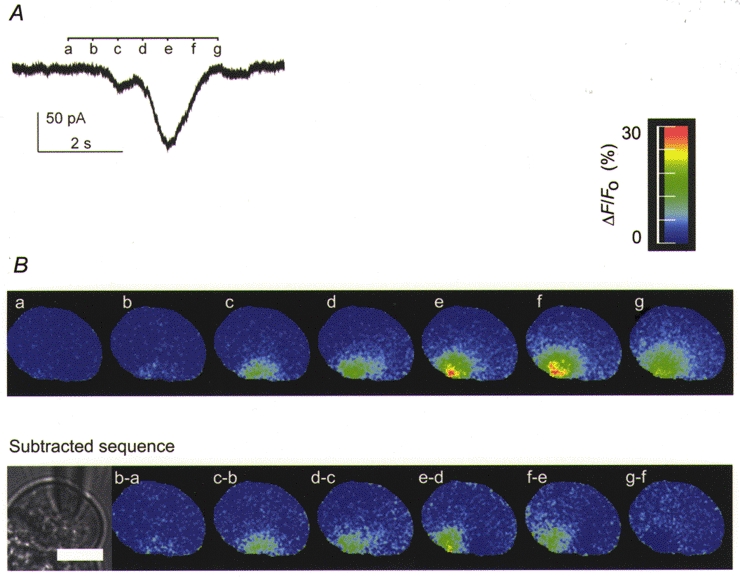
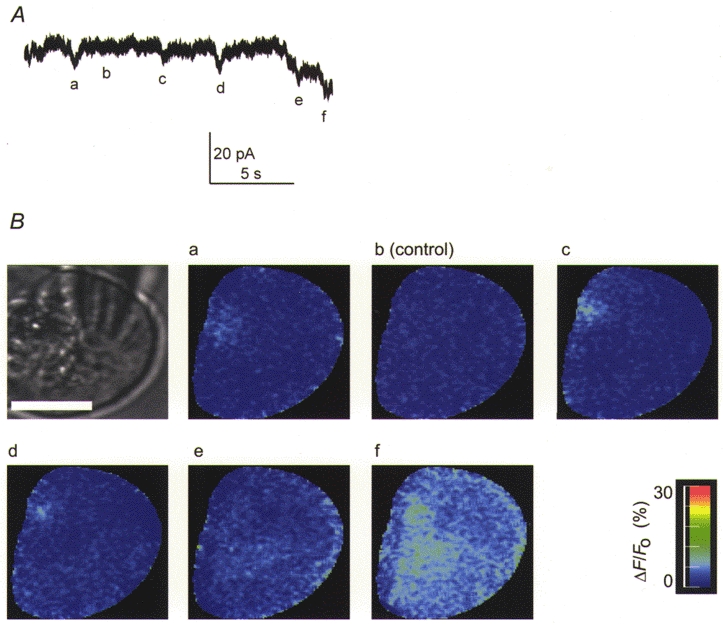
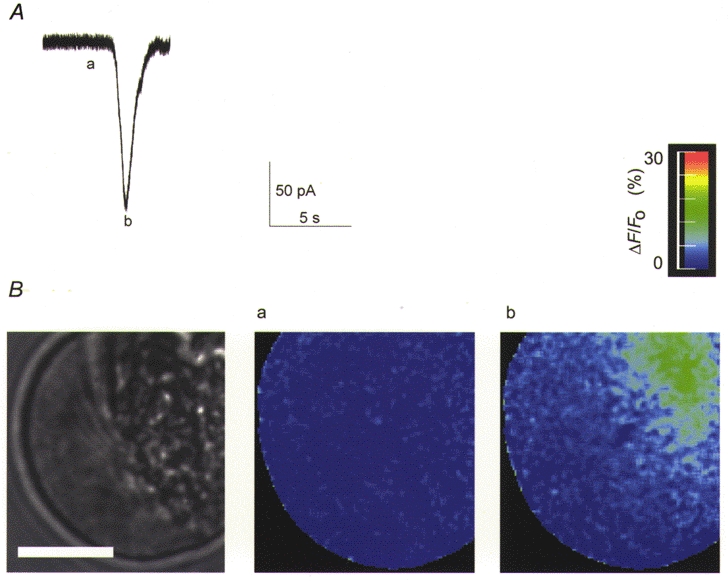
1. Cytosolic Ca2+ has been proposed to act as both a positive and a negative feedback signal on the inositol trisphosphate (InsP3) receptor. However, it is unclear how this might affect the Ca2+ response in vivo. 2. Mouse pancreatic acinar cells were whole-cell patch clamped to record the Ca2+-dependent chloride (Cl(Ca)) current spikes and imaged to record the cytosolic Ca2+ spikes elicited by the injection of Ins(2,4,5)P3. Increasing concentrations of Ca2+ buffer (up to 200 microM EGTA or BAPTA) were associated with the appearance of steps in the current activation phase and a prevalence of smaller-amplitude Cl(Ca) spikes. Imaging experiments showed that with increased buffer the secretory pole cytosolic Ca2+ signal became fragmented and spatially discrete Ca2+ release events were observed. 3. At higher buffer concentrations (200-500 microM), increasing concentrations of EGTA increased spike frequency and reduced spike amplitude. In contrast, BAPTA decreased spike frequency and maintained large spike amplitudes. 4. We conclude that, during InsP3-evoked spiking, long-range Ca2+ feedback ( approximately 2-4 microm) shapes the rising phase of the Ca2+ signal by acting to co-ordinate discrete Ca2+ release events and short-range ( approximately 40 nm) Ca2+ feedback acts to inhibit further Ca2+ release.


Figures

Figure 1
Figure 1. Trains of current spikes induced by injections of Ins(2,4,5)P3
Representative electrophysiological data obtained from a single whole-cell patch clamped acinar cell held under voltage clamp at a membrane potential of −30 mV in the presence of 50 μm EGTA. The upper horizontal line shows the zero current level in this figure (and in others). The record was obtained immediately after breaking through to the whole-cell configuration and shows the stable nature of the spike responses, which are of similar frequency and amplitude throughout the time of recording. The period of time used in the analysis of spike parameters was always 150 s after breakthrough to whole cell and was itself 150 s long. The period of analysis, for this cell, is indicated below the figure.
Figure 2
Figure 2. Graphs of peak current spike amplitude plotted against Ca2+ buffer concentration
EGTA, ▪ and continuous line; BAPTA, • and dashed line. These graphs and those of Figs 3 and 4, show the mean ±s.e.m. spike amplitudes obtained from at least 3 separate cells at each buffer concentration. In the presence of EGTA increasing buffer led to a steady decrease in spike amplitude. In contrast a complex relationship of initial decline followed by variable amplitudes was observed in the presence of increasing BAPTA concentrations.
Figure 3
Figure 3. Graphs of spike frequency plotted against Ca2+ buffer concentration
EGTA, ▪ and continuous line; BAPTA, • and dashed line. Spike frequency was measured independent of spike size. The minimum spike size measured was 10 pA. The graphs show divergent effects of the different buffers. Increasing concentrations of EGTA lead to an increase in spike frequency, whereas increasing concentrations of BAPTA lead to a decrease in spike frequency.
Figure 4
Figure 4. Graphs of average rate of current rise plotted against Ca2+ buffer concentration
EGTA, ▪ and continuous line; BAPTA, • and dashed line. In both cases EGTA and BAPTA led to a decrease in the average rate of rise of the Cl(Ca) current signal.
Figure 10
Figure 10. Examples of current records obtained in the whole-cell patch clamp configuration with either 500 μm EGTA (A) or 500 μm BAPTA (B)
The typical high-frequency, low-amplitude spikes seen with EGTA are in contrast with the large-amplitude, low-frequency spikes seen in the presence of BAPTA. The long horizontal line indicates the zero current level. The short filled bar above the zero current line indicates the part of the record shown expanded below. The membrane potential was voltage clamped at −30 mV.
Figure 5
Figure 5. The rate of rise of the Cl(Ca) current signal closely follows the calcium signal
Examples of normalised current spikes in the presence of 50 μm BAPTA and EGTA are shown in the figure. The activation phase is monotonic and relatively slow (≈1 s to reach peak). The figure also shows the Cl(Ca) current response recorded in response to the rapid photolytic release of Ca2+ from DM-nitrophen. This experiment was conducted after the partial replacement of the extracellular monovalent cations with NMDG and the cells were voltage clamped at a membrane potential of −17 mV (the equilibrium potential for the remaining cations). For this reason the current amplitude was slightly smaller and therefore we have scaled the responses to their maxima. The figure shows the much more rapid initial activation phase observed in response to photolytic release of Ca2+ compared with the responses to Ins(2,4,5)P3.
Figure 6
Figure 6. Examples of current spikes in the presence of 10, 50 and 200 μm EGTA
A-C, expanded traces correspond to the region of the record indicated by the short filled bar above the zero current line. At 200 μm EGTA a higher frequency of smaller events and the appearance of steps in the spike activation phase were observed (note the different amplitude scale). D, frequency-amplitude histograms drawn up from this dataset. At 50 μm EGTA there is a clustering of high amplitude events which contrasts with the spread of amplitudes seen at the higher Ca2+ buffer concentration.
Figure 7
Figure 7. The Ins(2,4,5)P3-induced Ca2+ spike response measured with Calcium Green in a single whole-cell patch clamped pancreatic acinar cell
A, time course of the whole-cell current response. B, ΔF/Fo digital images at the points a-e in A. The response originates at a single spot and spreads rapidly through the secretory pole over the time course of the activation phase of the spike. It appears as if the current inactivates much more rapidly than the decay in the bulk cytosolic Ca2+. In support of this the time to reach half peak amplitude (t½) of the Ca2+ signal was 1.2 ± 0.24 s (mean ±s.e.m., n = 3), and of the current was 0.53 ± 0.07 s (mean ±s.e.m., n = 3, means significantly different, P < 0.05, Student's one-tailed t test). Scale bar, 10 μm.
Figure 8
Figure 8. An example of a spike Cl(Ca) current response and simultaneously recorded Ca2+ response measured with Calcium Green fluorescence induced by Ins(2,4,5)P3 in the presence of 200 μm EGTA
A, a single clear step is seen in the Cl(Ca) current activation phase. B, the series of fluorescence images (upper panel) show the Ca2+ signal at the time points indicated (a-g). The signal looks similar to that in control (Fig. 7) in terms of amplitude but has an additional slow spreading component. This is seen more clearly in the subtracted images (lower panel) where the change in Ca2+ response moves across the secretory pole in a right to left direction. In all of the data showing steps in the current activation phase, the analysed images were consistent with multiple components to the secretory pole response. A scale bar of 10 μm is shown on the black and white image of the cell.
Figure 9
Figure 9. An example of current records obtained under similar conditions (200 μm EGTA, 50 μm Calcium Green) to Fig. 8 but showing evidence of smaller Cl(Ca) current spikes
The whole-cell current records are shown in A and simultaneously recorded fluorescence images at the time points indicated (a-f) are shown in B. A scale bar representing 10 μm is shown on the black and white image of the cell. Any given series of images were limited in length by the memory limitations of the computer and image capture was triggered by the experimenter. In this example the first images and Cl(Ca) currents show evidence of spike activity. The ‘control’ image is therefore shown in b, where there is neither current nor fluorescence evidence for a response. Images c and d show a very small Ca2+ response in the same region of the cell (our spatial resolution for the centre of the Ca2+ response is 200 nm). In image a, an apparently smaller Ca2+ response in a different region of the cell gives rise to a larger Cl(Ca) current spike. Image e was taken at the peak of a larger Cl(Ca) current spike and shows a diffuse Ca2+ signal in a region distinct from the Ca2+ release sites of the previous images. Image f shows the Ca2+ response during a larger Cl(Ca) current response. The differences in amplitude of the Ca2+ signal may well be due to Ca2+ release events occurring in and out of the plane of focus. We therefore make no conclusions about the size of the Ca2+ release events. It is clear, however, that individual Cl(Ca) current spikes arise from spatially separate Ca2+ release events.
Figure 11
Figure 11. A single Cl(Ca) current spike (A) recorded in the presence of 500 μm BAPTA, and simultaneously captured fluorescence imaging data (B)
The current is of large amplitude and the Ca2+ response shows a Ca2+ change very similar to that in the control (Fig. 7). This is despite the large increase in buffering power of the cytosol and indicates an increase in the amount of Ca2+ released. The scale bar on the black and white image of the cell represents 10 μm.

Similar articles

Cited by

References

    1. Arreola J, Melvin JE, Begenisich T. Activation of calcium-dependent chloride channels in rat parotid acinar cells. Journal of General Physiology. 1996;108:35–47. - PMC - PubMed
    1. Berridge MJ, Dupont G. Spatial and temporal signalling by calcium. Current Opinion in Cell Biology. 1994;6:267–274. - PubMed
    1. Bezprozvanny I, Watras J, Ehrlich BE. Bell-shaped calcium-response curves of Ins(1,4,5)P3- and calcium-gated channels from endoplasmic reticulum of cerebellum. Nature. 1991;351:751–754. - PubMed
    1. Boitier E, Rea R, Duchen MR. Mitochondria exert a negative feedback on the propagation of intracellular Ca2+ waves in rat cortical astrocytes. Journal of Cell Biology. 1999;145:795–808. - PMC - PubMed
    1. Bootman MD, Berridge MJ, Lipp P. Cooking with calcium: the recipes for composing global signals from elementary events. Cell. 1997;91:367–373. - PubMed

Publication types

MeSH terms

LinkOut - more resources