. 1999 Oct 1;520 Pt 1(Pt 1):203-15.
doi: 10.1111/j.1469-7793.1999.00203.x.

Low [ATP] and elevated [Mg2+] reduce depolarization-induced Ca2+ release in rat skinned skeletal muscle fibres

Affiliations

Low [ATP] and elevated [Mg2+] reduce depolarization-induced Ca2+ release in rat skinned skeletal muscle fibres

R Blazev et al. J Physiol. .

Abstract

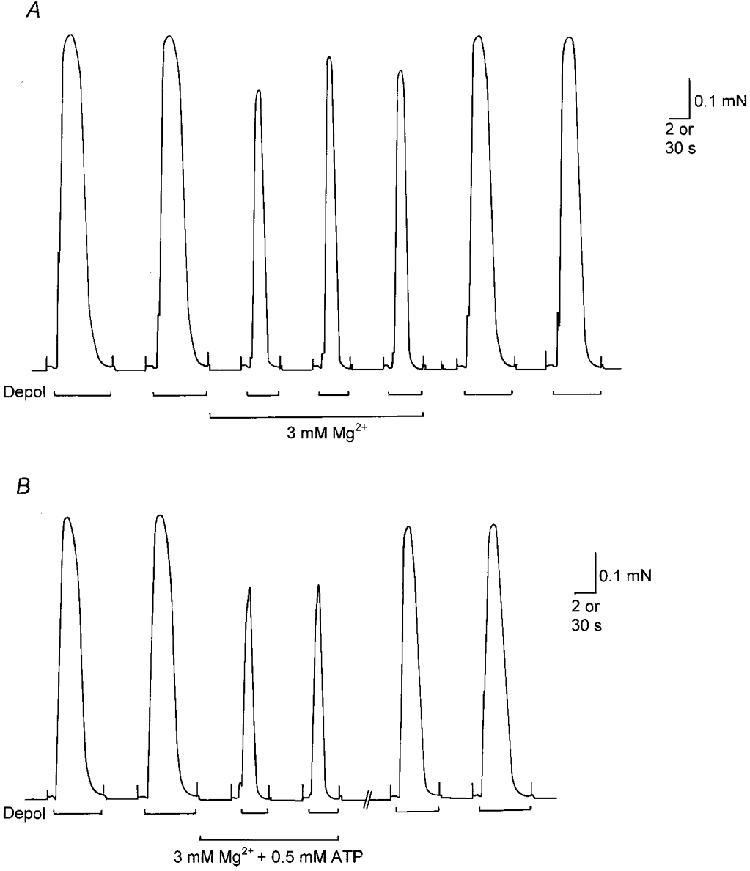
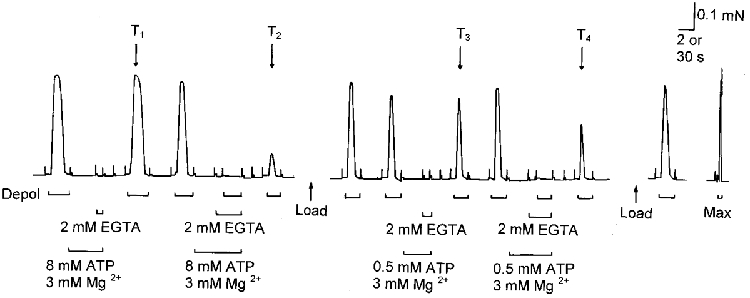
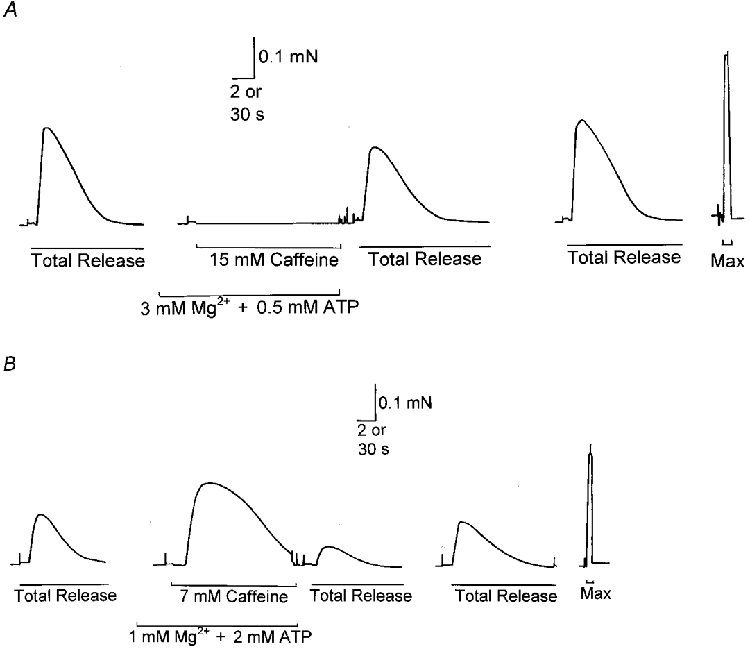
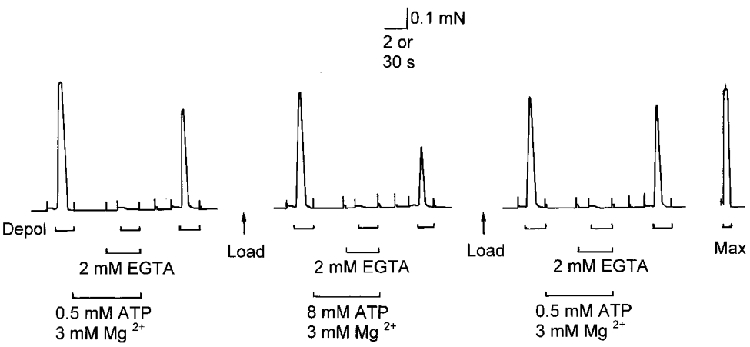
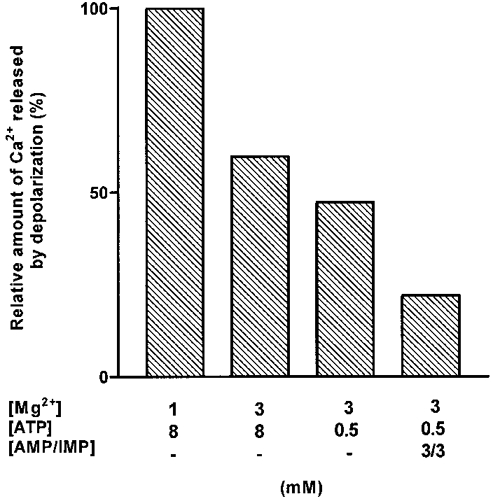
1. This study examined whether reduced [ATP], raised [Mg2+] and the presence of the metabolites AMP and inosine monophosphate (IMP) affected depolarization-induced Ca2+ release from the sarcoplasmic reticulum (SR) in mechanically skinned skeletal muscle fibres of the rat. The amount of Ca2+ released was determined from the extent of SR Ca2+ depletion following a depolarization in the specified conditions with 2 mM free EGTA present to chelate released Ca2+. 2. In the presence of 8 mM total ATP and 1 mM free Mg2+, most of the SR Ca2+ could be released by a single (2-3 s) depolarization. Paired comparisons in the same fibres showed that raising the [Mg2+] from 1 to 3 mM reduced the total amount of Ca2+ released by a single depolarization by approximately 40 %. At 1 mM Mg2+, lowering the [ATP] to 0.5 mM did not cause a detectable change in the total amount of Ca2+ released, but when the release rate was reduced by the presence of 3 mM Mg2+, lowering the [ATP] to 0.5 mM resulted in a further ( approximately 20 %) reduction in the total amount of Ca2+ released. 3. At 1 mM Mg2+ and 0.5 mM ATP, neither the presence of 3 mM AMP alone nor 3 mM AMP plus 3 mM IMP caused a significant change in total Ca2+ release. Furthermore, at 1 mM Mg2+, the combined effect of lowering the [ATP] from 8 to 0.5 mM and simultaneously adding 3 mM AMP and 3 mM IMP did not significantly alter total Ca2+ release. However, when Ca2+ release was already reduced by the presence of 3 mM Mg2+ and 0.5 mM ATP (to approximately 50 %), addition of 3 mM AMP and 3 mM IMP significantly reduced the amount of Ca2+ released a further 2-fold. 4. These results show that depolarization-induced Ca2+ release in mammalian muscle fibres is modulated by the concentration of ATP and its metabolic products, as well as by the free [Mg2+]. Consequently, the (reversible) reduction in Ca2+ release occurring in a muscle fibre after prolonged exercise could result not only from raised [Mg2+] but also from a severe reduction in [ATP] locally near the Ca2+ release channels, with the accompanying build-up of AMP and IMP further exacerbating this effect.


Figures

Figure 1
Figure 1. Effect of raised [Mg2+] and low [ATP] on depolarization-induced force responses in rat skinned skeletal muscle fibres
A, in the presence of 1 mm free Mg2+ and 8 mm total ATP, depolarizing the T-system of an EDL fibre by Na+ substitution (Depol) elicited rapid Ca2+ release and a large force response. Raising the [Mg2+] to 3 mm reduced the size and duration of the depolarization-induced force response. B, effect of 3 mm Mg2+ and 0.5 mm ATP in another EDL fibre. In both A and B for all solutions, pCa 6.9–7.0, 0.025 mm total EGTA. Time scale, 2 s during depolarizations and 30 s between.
Figure 2
Figure 2. Assay of the amount of Ca2+ released by depolarization at 8 and 0.5 mm ATP in the presence of 3 mm Mg2+
The skinned EDL fibre was depolarized under standard conditions (see below) both before and after each of four different treatments (exposure to 3 mm Mg2+-2 mm EGTA, with 8 or 0.5 mm ATP, and with or without depolarization), and the effect of each treatment was gauged by the change in the size of the following test response under standard conditions (marked T1 to T4). Firstly, the response to depolarization was ascertained before and after exposing the fibre to a solution containing 8 mm ATP, 3 mm Mg2+ and 2 mm EGTA (pCa > 8) for 15 s without any depolarization (‘leakage’ in 8 mm ATP-3 mm Mg2+), and there was little change in the response (T1). Secondly, the fibre was exposed to the same solution and depolarized during the last 2 s (depolarization in 8 mm ATP-3 mm Mg2+), resulting in a substantial reduction in the subsequent test response (T2). Thirdly, the SR was reloaded with Ca2+ until the response was similar to the preceding control level and then the fibre was exposed to a solution with 0.5 mm ATP, 3 mm Mg2+ and 2 mm EGTA (pCa > 8) without any depolarization (‘leakage’ in 0.5 mm ATP-3 mm Mg2+), causing little change in the subsequent test response (T3). Finally, the fibre was exposed to the same 0.5 mm ATP solution and depolarized (depolarization in 0.5 mm ATP-3 mm Mg2+), resulting in a moderate reduction in the subsequent response (T4). In each case, the fibre was pre-equilibrated at the given [ATP] and [Mg2+] (at pCa ≈7.0) for 30 s before exposure to the corresponding 2 mm EGTA solution. Maximum Ca2+-activated force was determined by exposure to a solution with 50 mm Ca-EGTA (pCa 4.5) (Max). Time scale, 2 s during depolarizations and 30 s elsewhere. Standard conditions were used (1 mm Mg2+, 8 mm ATP, 0.025 mm EGTA, pCa ≈7.0) except where indicated.
Figure 4
Figure 4. Caffeine-induced Ca2+ release is suppressed by high [Mg2+] and low [ATP]
A, the SR of an EDL fibre was depleted of all of its Ca2+ by exposing the fibre to 30 mm caffeine-low [Mg2+] solution (pCa 8, 0.5 mm EGTA, 8 mm ATP; see Methods) (Total Release), with the area (i.e. time integral) of the force response being indicative of the total amount of Ca2+ released (see Results). After reloading the SR to the original level (35 s load at pCa 6.7, 1 mm EGTA), the fibre was equilibrated in 3 mm Mg2+-0.5 mm ATP (pCa ≈7.0, 0.025 mm EGTA) and gave no response whatsoever during a 15 s exposure to 15 mm caffeine. The SR was then fully depleted of Ca2+ again (second Total Release) and the somewhat reduced force response indicated that some Ca2+ had in fact been lost from the SR during exposure to the 15 mm caffeine solution. Finally, the SR was reloaded again and the initial control procedure repeated (third Total Release). B, in contrast, when a different EDL fibre was equilibrated with 1 mm Mg2+ and 2 mm ATP present in the solution, exposure to only 7 mm caffeine induced a large force response and a considerable loss of Ca2+ from the SR (see reduction in the following Total Release). The fibre was reloaded for 30 s between stimuli, as in A. Time scale, 2 s throughout, except during washout period preceding second Total Release in both A and B where it is 30 s.
Figure 3
Figure 3. Repeated treatments in the same fibre
The amount of Ca2+ released by a depolarization in the presence of 0.5 mm ATP-3 mm Mg2+ was assayed both before and after testing with 8 mm ATP-3 mm Mg2+, and similar responses were obtained. Time scale, 2 s during depolarizations and 30 s elsewhere. Standard conditions were used (1 mm Mg2+, 8 mm ATP, 0.025 mm EGTA, pCa ≈7.0) except where indicated.
Figure 5
Figure 5. Relative amount of Ca2+ released with cumulative addition of various factors
The bars indicate the amount of Ca2+ released by a depolarization relative to that with 1 mm Mg2+ and 8 mm ATP, for progressively changing from 1 to 3 mm Mg2+ (at 8 mm ATP) and from 8 to 0.5 mm ATP (at 3 mm Mg2+), and finally adding 3 mm AMP and 3 mm IMP (at 0.5 mm ATP-3 mm Mg2+). The relative sizes of adjacent bars are derived from the Ca2+ content decreases in Table 1 and simply indicate the relative change in Ca2+ release found by paired comparison of the indicated conditions (i.e. relative changes, left to right: 59.7, 79.1 and 46.5 % - see Table 1). The total reduction in Ca2+ release found by the cumulative combination of all three factors (decrease to 22.0 %) is very similar to that seen directly in the total (non-paired) data in Table 2 (i.e. Ca2+ release in 0.5 mm ATP-3 mm Mg2+ with 3 mm IMP and 3 mm AMP is 26.4 % of that in 8 mm ATP-1 mm Mg2+).

References

    1. Allen DG, Lännergren J, Westerblad H. Muscle cell function during prolonged activity: cellular mechanisms of fatigue. Experimental Physiology. 1995;80:497–527. - PubMed
    1. Allen DG, Lännergren J, Westerblad H. The role of ATP in the regulation of intracellular Ca2+ release in single fibres of mouse skeletal muscle. The Journal of Physiology. 1997a;498:587–600. - PMC - PubMed
    1. Allen DG, Lännergren J, Westerblad H. Caged compounds affect calcium release in intact mouse skeletal muscle fibres. Proceedings of the Australian Physiological and Pharmacological Society. 1997b;28:15P.
    1. Anderson K, Meissner G. T-tubule depolarization-induced SR Ca2+ release is controlled by dihydropyridine receptor- and Ca2+-dependent mechanisms in cell homogenates from rabbit skeletal muscle. Journal of General Physiology. 1995;105:363–383. - PMC - PubMed
    1. Bakker AJ, Lamb GD, Stephenson DG. The effect of 2,5-di-(tert-butyl)-1,4-hydroquinone on force responses and the contractile apparatus in mechanically skinned muscle fibres of the rat and toad. Journal of Muscle Research and Cell Motility. 1996;17:55–67. - PubMed

Publication types

MeSH terms

LinkOut - more resources