. 1999 Oct 1;520 Pt 1(Pt 1):217-30.
doi: 10.1111/j.1469-7793.1999.00217.x.

Differential effects of caffeine and perchlorate on excitation-contraction coupling in mammalian skeletal muscle

Affiliations

Differential effects of caffeine and perchlorate on excitation-contraction coupling in mammalian skeletal muscle

L Csernoch et al. J Physiol. .

Abstract

1. Enzymatically dissociated single muscle fibres of the rat were studied under voltage clamp conditions in a double Vaseline gap experimental chamber. Intramembrane charge movement and changes in intracellular calcium concentration ([Ca2+]i) were measured and the rate of calcium release (Rrel) from the sarcoplasmic reticulum (SR) was calculated. This enabled the determination of SR permeability and thus the estimation of the transfer function between intramembrane charge movement and SR permeability. 2. Perchlorate (3 mM) shifted the membrane potential dependence of intramembrane charge movement to more negative voltages without any effect on the steepness or on the maximal available charge. The drug increased SR permeability at every membrane potential but did not alter the peak-to-steady level ratio. It also increased the slope of the transfer function, indicating a more efficient coupling between the voltage sensors and the ryanodine receptors. 3. Caffeine (1 mM), on the other hand, increased SR permeability without altering the voltage dependence of intramembrane charge movement. It neither prolonged the depolarization-induced increase in [Ca2+]i at short pulse durations nor altered the time to peak of Rrel. The augmentation of SR permeability by the drug was more pronounced during the peak caffeine response than during its steady level. This was manifested in a leftward shift of the transfer function rather than an increase in its slope. 4. These observations indicate that perchlorate and caffeine alter the coupling between the voltage sensors and SR calcium release channels in mammalian skeletal muscle. They do not, however, share a common mechanism for enhancing the depolarization-induced release of calcium from the SR.


Figures

Figure 1
Figure 1. Perchlorate enhances SR calcium release in mammalian skeletal muscle
A, changes in the saturation of fura-2 during a 100 ms long depolarizing pulse to 0 mV before (control), during the presence (perchlorate) and after the removal (wash) of 3 mm perchlorate. B, calculated changes in [Ca2+]i. Note that the resting [Ca2+]i slightly increased during the experiment. C, SR calcium release fluxes calculated from the traces shown in B. The parameters of the removal model were obtained in the absence of the drug and used throughout. D, estimated SR permeability determined by correcting the records in C for the depletion of calcium in the SR and normalizing them to the calculated SR calcium content. Concentration of APIII ([APIII]) 559-652 μm, concentration of fura-2 ([fura-2]) 84-106 μm. Parameters of the removal model: koff,Mg-P = 6.0 s−1, PVmax = 1.76 mm s−1, kon,Ca-E = 1.55 μm−1 s−1, koff,Ca-E = 2.1 s−1. Estimated values for SR content (C0) before, during and after perchlorate application were 1.0, 0.9 and 0.6 mm, respectively.
Figure 2
Figure 2. Perchlorate induced alterations in SR permeability at different membrane potentials
Changes in SR permeability were calculated from the calcium release records using the SR content estimated under control conditions. A, SR permeability in the absence of the drug. B, SR permeability after the addition of 3 mm perchlorate. Note that the drug enhanced the calculated permeability increase at every voltage tested. The membrane potentials during the 100 ms long depolarizations are indicated next to the traces. [APIII]= 735-881 μm, [fura-2]= 83-108 μm. Parameters of the removal model: koff,Mg-P = 8.5 s−1, PVmax = 1.86 mm s−1, kon,Ca-E = 1.1 μm−1 s−1, koff,Ca-E = 2.4 s−1. C0 = 1.5 mm.
Figure 3
Figure 3. Caffeine potentiates calcium transients and the depolarization-induced SR permeability increase
A, changes in intracellular calcium concentration ([Ca2+]i) and in SR permeability (Rrel*/C0) under control conditions at a wide range of membrane potentials as indicated for each row. The depolarization lasted for 100 ms for all traces (bottom trace). B, the effect of 1 mm caffeine on [Ca2+]i and on Rrel*/C0. Note that caffeine enhanced both the calcium concentration increase and the calculated SR permeability change at all voltages tested. Calibration bars for [Ca2+]i and Rrel*/C0 are, respectively: horizontal, 200 and 100 ms; vertical, 1 μm and 1 % ms−1. [APIII]= 829-930 μm, [fura-2]= 159-163 μm. Parameters of the removal model: koff,Mg-P = 2.2 s−1, PVmax = 3.9 mm s−1, kon,Ca-E = 0.9 μm−1 s−1 and koff,Ca-E = 5.8 s−1. C0 = 2.5 mm.
Figure 4
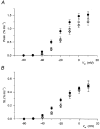
Figure 4. Effect of perchlorate on the two kinetic components of SR permeability increase
Values from 8 different fibres measured at corresponding membrane potentials were averaged before (○) and during (•) addition of perchlorate and after its removal (⋄). A, the effect of the drug on the peak, defined as the maximal value in the first 40 ms of the pulse, of SR permeability increase. B, the effect of perchlorate on the steady component (SL) of SR permeability. Note that perchlorate increased both the early peak and the maintained steady level at all voltages examined.
Figure 5
Figure 5. Effect of caffeine on the two kinetic components of SR permeability increase
Data in the absence (○, control; ⋄, wash) and presence (•) of caffeine from 10 fibres were averaged as described in the legend to Fig. 4 for corresponding measurements. A, the effect of caffeine on the peak of SR permeability. B, the effect of the drug on the steady component (SL). Note that while the peak was increased at all voltages the effect on the steady level was not as pronounced, especially at large voltages.
Figure 6
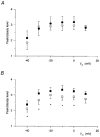
Figure 6. Differential alteration of the peak-to-steady level ratio of SR permeability by perchlorate and caffeine
The peak-to-steady level ratio was calculated for each individual record and then the values obtained at the corresponding membrane potentials from different fibres were averaged. The average of the data obtained before the addition of the drug and after wash was used as control (open symbols). Only those fibres in which the challenge with the particular drug was carried out were included in the control and thus the control values in A and B are from different sets of experiments. A, data obtained in the presence (•) and absence (○) of perchlorate. Note that in spite of the large effect on the two components (Fig. 4) the ratio was essentially unaltered. B, values in the presence (▪) and absence (□) of caffeine. Unlike perchlorate, caffeine slightly increased the peak-to-steady level ratio. Same fibres as in Figs 4 and 5. Asterisks mark significant changes.
Figure 7
Figure 7. Membrane potential dependence of intramembrane charge transfer
Non-linear membrane currents (shown in insets for a depolarization to −20 mV; horizontal calibration 50 ms, vertical calibration 1 A F−1) were integrated to obtain the charge moved at a given voltage. These values were then normalized to the maximal available charge in reference conditions (Q/Qmax) and averaged at each and every membrane potential. The normalized and averaged data were fitted with eqn (1) (superimposed curves) both in the absence (continuous curves) and presence (dotted curves) of the drugs. A, the effect of perchlorate (•) was to shift the membrane potential dependence to more negative voltages compared to control (○). Parameters obtained from the fits for reference conditions and in the presence of perchlorate are, respectively: V′=−8.4 and −16.0 mV, k = 15.6 and 14.3 mV. The normalized Qmax was 0.99 in the presence of perchlorate. B, caffeine (▪) did not alter the voltage dependence of intramembrane charge. Parameters obtained from the fits for reference conditions and in the presence of perchlorate are, respectively: V′=−19.6 and −20.8 mV, k = 16.1 and 15.3 mV. The normalized Qmax was 1.02 in the presence of caffeine.
Figure 8
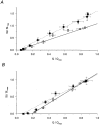
Figure 8. Transfer functions in the presence of perchlorate and caffeine
To calculate the transfer function the normalized and averaged steady SR permeability (SL/SLmax) was plotted as a function of the normalized and averaged charge (Q/Qmax). Superimposed lines represent the least squares fit of a straight line to the data points (7 points) above the threshold for the appearance of an SR permeability increase in reference conditions (continuous lines) and in the presence of the drugs (dotted lines). A, transfer function in the absence (○) and presence (•) of perchlorate. Note the increased slope (m). Parameters of the straight lines for reference conditions and in the presence of perchlorate are, respectively: m = 1.212 and 1.627, the threshold charge (Qth, the x-axis intercept) = 0.026 and 0.012, regression coefficient (r2) = 0.963 and 0.991. B, transfer functions in the absence (□) and presence (▪) of caffeine. Parameters of the straight lines for reference conditions and in the presence of perchlorate are, respectively: m = 1.454 and 1.242, Qth = 0.185 and 0.070, r2 = 0.993 and 0.982.
Figure 9
Figure 9. Effect of caffeine on [Ca2+]i and Rrel evoked using different pulse durations
A-C, calcium transients ([Ca2+]i) and the underlying SR calcium release elicited using 10, 15, 40 and 100 ms depolarizing pulses to 0 mV. The pulse protocol is shown below the records. The measurement was carried out in control (A), in the presence of caffeine (B) and after the removal of the drug (C). Calibration bars for [Ca2+]i and for Rrel are, respectively: vertical, 0.5 μm and 15 μm ms−1; horizontal, 100 and 50 ms. D, time-to-peak (TTP) values of the calcium transients and the calculated SR calcium release for the 10, 15 and 40 ms depolarizations in control (○), after the addition of caffeine (•) and after wash (□). Values were calculated from the transients shown in A-C. Note that caffeine did not influence the TTP. [APIII]= 995-1403 μm, [fura-2]= 97.6–149.6 μm. Parameters of the removal model: koff,Mg-P = 14.5 s−1, PVmax = 1.6 mm s−1, kon,Ca-E = 2.2 μm−1 s−1 and koff,Ca-E = 1.9 s−1.

Similar articles

Cited by

References

    1. Block BA, Imagawa T, Campbell KP, Franzini-Armstrong C. Structural evidence for direct interaction between the molecular components of the transverse tubule/sarcoplasmic reticulum junction in skeletal muscle. Journal of Cell Biology. 1988;107:2587–2600. - PMC - PubMed
    1. Csernoch L, Jacquemond V, Schneider MF. Microinjection of strong calcium buffers suppresses the peak of calcium release in frog skeletal muscle fibers. Journal of General Physiology. 1993;101:297–333. - PMC - PubMed
    1. Csernoch L, Kovács L, Szücs G. Perchlorate and the relationship between charge movement and contractile activation in frog skeletal muscle fibres. The Journal of Physiology. 1987;390:213–227. - PMC - PubMed
    1. Csernoch L, Szentesi P, Sárközi S, Szegedi C, Jona I, Kovács L. Effects of tetracaine on sarcoplasmic calcium release in mammalian skeletal muscle fibres. The Journal of Physiology. 1999;515:843–857. - PMC - PubMed
    1. González A, Ríos E. Perchlorate enhances transmission in skeletal muscle excitation-contraction coupling. Journal of General Physiology. 1993;102:373–421. - PMC - PubMed

Publication types

MeSH terms