

Auxin and cytokinin have opposite effects on amyloplast development and the expression of starch synthesis genes in cultured bright yellow-2 tobacco cells
- PMID: 10517837
- PMCID: PMC59408
- DOI: 10.1104/pp.121.2.461
Auxin and cytokinin have opposite effects on amyloplast development and the expression of starch synthesis genes in cultured bright yellow-2 tobacco cells
Abstract
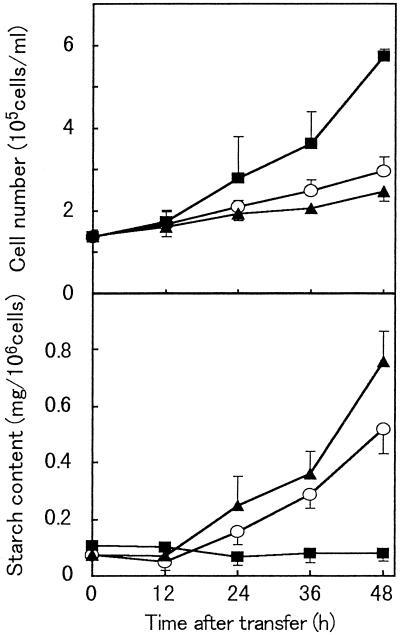
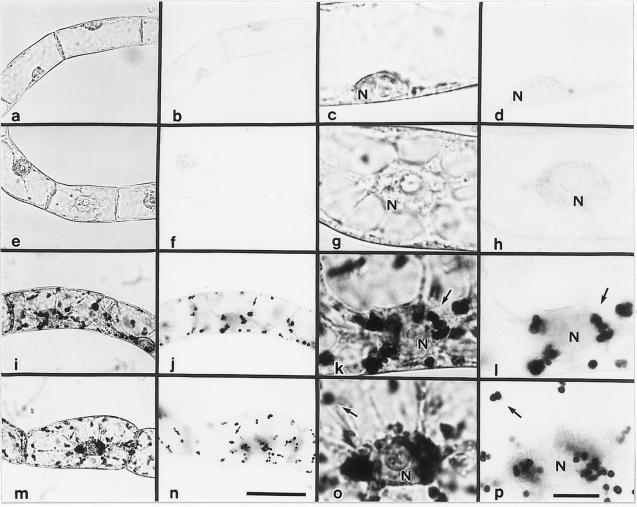
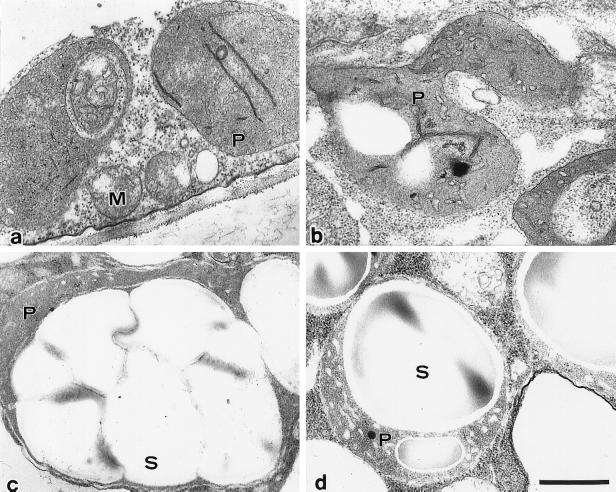
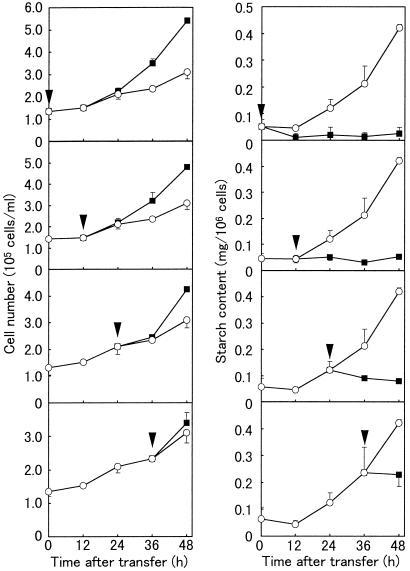
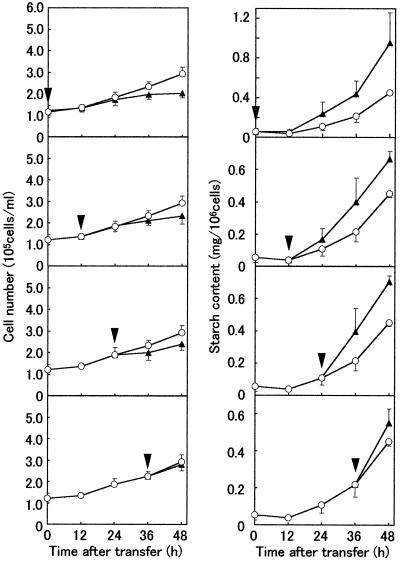
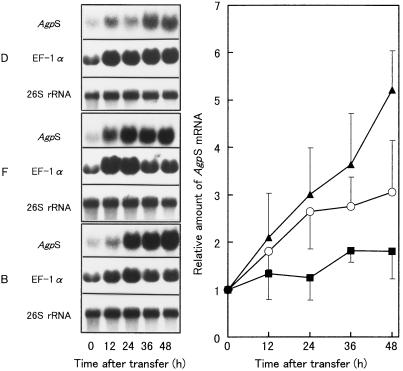
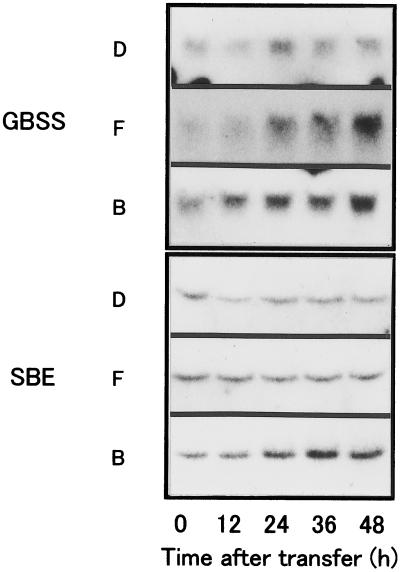
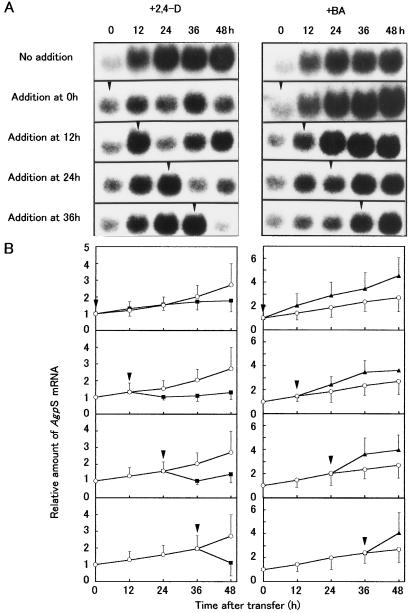
In cultured Bright Yellow-2 (BY-2) tobacco (Nicotiana tabacum) cells, the depletion of auxin (2,4-dichlorophenoxyacetic acid) in the culture medium induces the accumulation of starch. This is accelerated by the addition of cytokinin (benzyladenine). Light and electron microscopic observations revealed that this amyloplast formation involves drastic changes in plastid morphology. The effects of auxin and cytokinin on amyloplast development were investigated by adding auxin or cytokinin to cells grown in a hormone-free culture. Auxin repressed amyloplast development, whereas cytokinin accelerated starch accumulation regardless of the timing of hormone addition. RNA gel-blot analysis revealed that the accumulation of the ADP-glucose pyrophosphorylase small subunit gene (AgpS), granule-bound starch synthase, and starch branching enzyme transcripts were also affected by hormonal conditions. High levels of AgpS, granule-bound starch synthase, and starch branching enzyme transcripts accumulated in amyloplast-developing cells grown in auxin-depleted conditions. Furthermore, the addition of auxin to the cells cultured in hormone-free medium reduced the level of AgpS transcripts, whereas the addition of cytokinin increased it, irrespective of the timing of hormone addition. These results suggest that auxin and cytokinin exert opposite effects on amyloplast development by regulating the expression of the genes required for starch biosynthesis.
Figures
Similar articles
-
Amyloplast formation in cultured tobacco BY-2 cells requires a high cytokinin content.Plant Cell Physiol. 2002 Dec;43(12):1534-41. doi: 10.1093/pcp/pcf173. Plant Cell Physiol. 2002. PMID: 12514251
-
Plastid-to-nucleus retrograde signals are essential for the expression of nuclear starch biosynthesis genes during amyloplast differentiation in tobacco BY-2 cultured cells.Plant Physiol. 2011 Sep;157(1):518-30. doi: 10.1104/pp.111.178897. Epub 2011 Jul 19. Plant Physiol. 2011. PMID: 21771917 Free PMC article.
-
Biochemistry, molecular biology and regulation of starch synthesis.Genet Eng (N Y). 1998;20:177-223. doi: 10.1007/978-1-4899-1739-3_10. Genet Eng (N Y). 1998. PMID: 9666561 Review. No abstract available.
-
Identification and characterization of a novel cassava (Manihot esculenta Crantz) clone with high free sugar content and novel starch.Plant Mol Biol. 2004 Nov;56(4):643-59. doi: 10.1007/s11103-004-4873-9. Plant Mol Biol. 2004. PMID: 15630625
-
[Key enzymes in starch synthesis in plants].Yi Chuan. 2006 Jan;28(1):110-6. Yi Chuan. 2006. PMID: 16469726 Review. Chinese.
Cited by
-
Effect of Removing Superior Spikelets on Grain Filling of Inferior Spikelets in Rice.Front Plant Sci. 2016 Aug 5;7:1161. doi: 10.3389/fpls.2016.01161. eCollection 2016. Front Plant Sci. 2016. PMID: 27547210 Free PMC article.
-
Genotype-dependent changes of gene expression during somatic embryogenesis in oil palm hybrids (Elaeis oleifera x E. guineensis).PLoS One. 2018 Dec 31;13(12):e0209445. doi: 10.1371/journal.pone.0209445. eCollection 2018. PLoS One. 2018. PMID: 30596686 Free PMC article.
-
Plastidic phosphoglucose isomerase is an important determinant of starch accumulation in mesophyll cells, growth, photosynthetic capacity, and biosynthesis of plastidic cytokinins in Arabidopsis.PLoS One. 2015 Mar 26;10(3):e0119641. doi: 10.1371/journal.pone.0119641. eCollection 2015. PLoS One. 2015. PMID: 25811607 Free PMC article.
-
Mitochondria-driven changes in leaf NAD status exert a crucial influence on the control of nitrate assimilation and the integration of carbon and nitrogen metabolism.Plant Physiol. 2005 Sep;139(1):64-78. doi: 10.1104/pp.105.066399. Epub 2005 Aug 26. Plant Physiol. 2005. PMID: 16126851 Free PMC article.
-
Solanum lycopersicum GOLDEN 2-LIKE 2 transcription factor affects fruit quality in a light- and auxin-dependent manner.PLoS One. 2019 Feb 12;14(2):e0212224. doi: 10.1371/journal.pone.0212224. eCollection 2019. PLoS One. 2019. PMID: 30753245 Free PMC article.
References
-
- Ball S, Guan H, James M, Meyers A, Keeling P, Mouille G, Buléon A, Colonna P, Preiss J. From glycogen to amylopectin: a model for the biogenesis of the plant starch granule. Cell. 1996;86:349–352. - PubMed
-
- Coenen C, Lomax TL. Auxin-cytokinin interactions in higher plants: old problems and new tools. Trends Plant Sci. 1997;9:351–355. - PubMed
-
- Dubois M, Gilles KA, Hamilton JK, Rebers PA, Smith F. Colorimetric method for determination of sugars and related substances. Anal Chem. 1956;28:350–356.
-
- Greene TW, Hannah LC. Adenosine diphosphate glucose pyrophosphorylase, a rate-limiting step in starch biosynthesis. Physiol Plant. 1998;103:574–580.
Publication types
MeSH terms
Substances
Associated data
- Actions
- Actions
- Actions
LinkOut - more resources
Full Text Sources
