. 1999 Oct;121(2):675-84.
doi: 10.1104/pp.121.2.675.

Analysis of the relative increase in photosynthetic O(2) uptake when photosynthesis in grapevine leaves is inhibited following low night temperatures and/or water stress

Affiliations

Analysis of the relative increase in photosynthetic O(2) uptake when photosynthesis in grapevine leaves is inhibited following low night temperatures and/or water stress

J Flexas et al. Plant Physiol. 1999 Oct.

Abstract

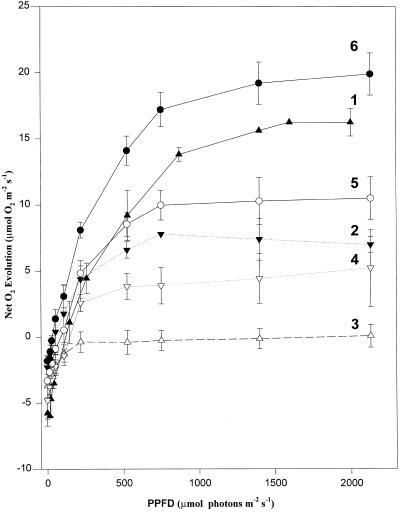
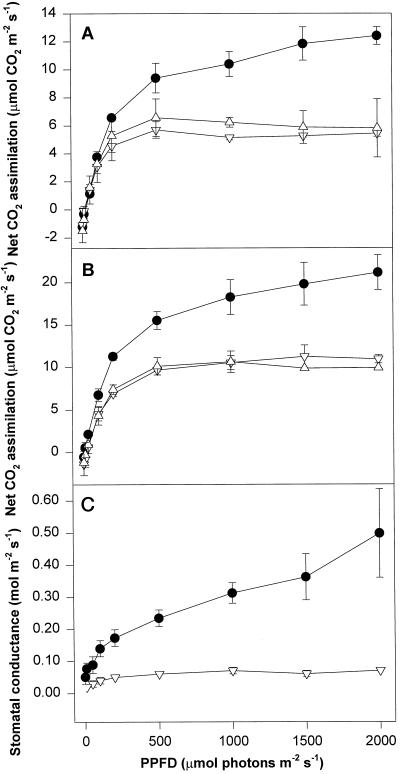
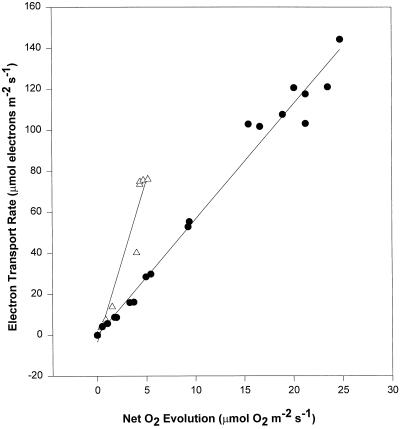
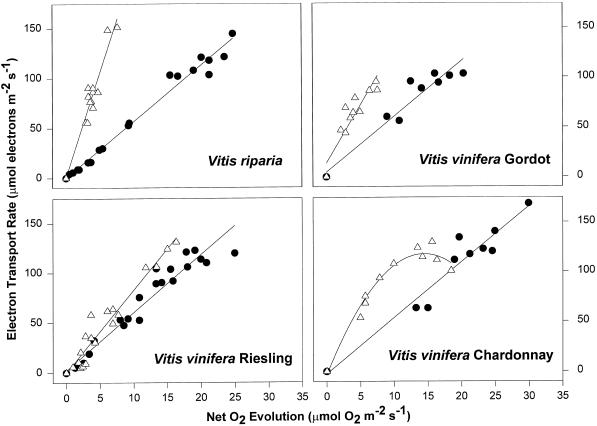
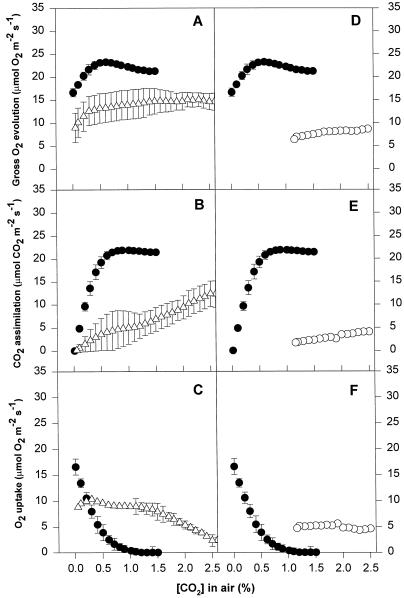
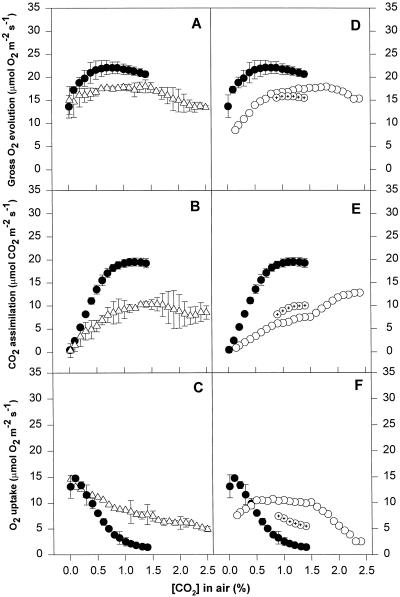
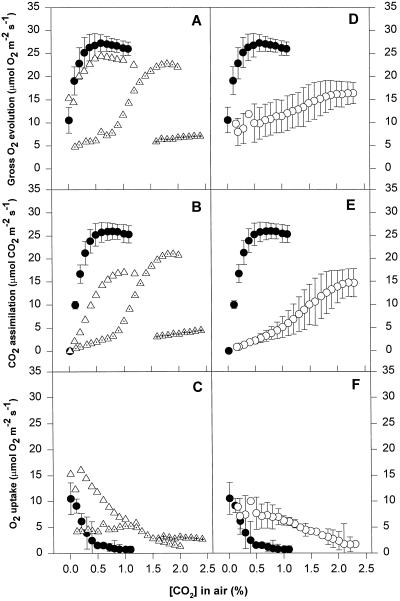
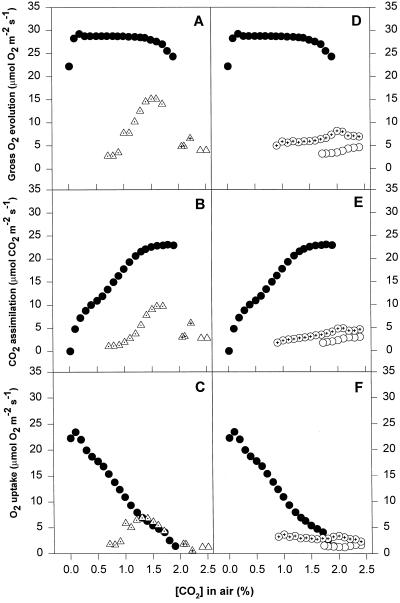
We found similarities between the effects of low night temperatures (5 degrees C-10 degrees C) and slowly imposed water stress on photosynthesis in grapevine (Vitis vinifera L.) leaves. Exposure of plants growing outdoors to successive chilling nights caused light- and CO(2)-saturated photosynthetic O(2) evolution to decline to zero within 5 d. Plants recovered after four warm nights. These photosynthetic responses were confirmed in potted plants, even when roots were heated. The inhibitory effects of chilling were greater after a period of illumination, probably because transpiration induced higher water deficit. Stomatal closure only accounted for part of the inhibition of photosynthesis. Fluorescence measurements showed no evidence of photoinhibition, but nonphotochemical quenching increased in stressed plants. The most characteristic response to both stresses was an increase in the ratio of electron transport to net O(2) evolution, even at high external CO(2) concentrations. Oxygen isotope exchange revealed that this imbalance was due to increased O(2) uptake, which probably has two components: photorespiration and the Mehler reaction. Chilling- and drought-induced water stress enhanced both O(2) uptake processes, and both processes maintained relatively high rates of electron flow as CO(2) exchange approached zero in stressed leaves. Presumably, high electron transport associated with O(2) uptake processes also maintained a high DeltapH, thus affording photoprotection.


Figures

Figure 1
Figure 1
Light response curves of net O2 evolution at 2.5% CO2 for V. riparia leaves at the beginning of the growing season. Values are average ± ses of three to five replicates. Curve 1 was measured October 31 (after several days with mean temperatures above 25°C and minimum night temperatures above 10°C). Curve 2 was measured November 3 (mean temperature previous days, 17°C; minimum night temperature, 8°C–9°C). Curve 3 was measured November 5 (mean temperature, 18°C; minimum night temperature, 9°C). Curves 4 to 6 were measured on November 6, 7, and 9, when the mean temperature increased to 25°C and minimum night temperatures were 11°C. Values of the quantum yield of O2 evolution (average ± se): curve 1, 0.074 ± 0.009; curve 2, not measured; curve 3, 0.038 ± 0.013; curve 4, 0.038 ± 0.002; curve 5, 0.047 ± 0.013; curve 6, 0.099 ± 0.014. Corresponding values of dark-adapted Fv/Fm (average ± se) were; curve 1, 0.809 ± 0.010; curve 2, not measured; curve 3, 0.812 ± 0.005; curve 4, 0.822 ± 0.003; curve 5, 0.818 ± 0.04; and curve 6, 0.821 ± 0.003.
Figure 2
Figure 2
Net CO2 assimilation in air, 360 ppm CO2 (A), net CO2 assimilation at 900 ppm CO2 (B), and stomatal conductance in air (C) of leaves of V. vinifera cv Riesling. This figure compares controls (●), CL leaves (▵), and CL leaves with the roots heated at 30°C during the night (▿).
Figure 3
Figure 3
Light response curve of net O2 evolution (corrected for respiration rates) at 2.5% CO2 for different species and cultivars of grape. The treatments are: controls (●), CD (▴), and CL (▵).
Figure 4
Figure 4
The relationship between ETR and net O2 evolution (corrected for respiration rates) from curves 1 and 6 (●) and curve 3 (▵) of Figure 1. The slopes of these relationships are 5.6 for controls and 15.7 for stressed leaves. The relationships for the other curves lie between these two curves (not shown).
Figure 5
Figure 5
The relationship between ETR and net O2 evolution (corrected for respiration rates) from data in Figure 3. The treatments shown are controls (●) and CL (▵). The data from CD treatments lie between these curves, except for V. riparia (not shown). The slopes of the relationships are: V. riparia control, 5.6; CD, 5.5; CL, 20.7; V. vinifera cv Riesling control, 5.8; CD, 6.7; CL, 8.3; V. vinifera cv Gordot control, 5.6; CD, 7.1; CL, 11.6; and V. vinifera cv Chardonnay control, 5.6; CD, 12.7; CL, 16.7.
Figure 6
Figure 6
Patterns of gas exchange as a function of CO2 concentration in leaf discs of V. riparia. All measurements were made at an incident PPFD of 1,000 μmol photons m−2 s−1. The CO2 concentration within the closed gas exchange system was approximately 3.0% at the beginning of the experiment and was allowed to deplete to a steady-state value as a consequence of CO2 assimilation. Values obtained during photosynthetic induction at high CO2 have been omitted. Data are provided for simultaneous gross O2 evolution, net CO2 uptake, and net O2 evolution. The controls (●) are shown for both CL experiments (left column graphs, ▵) and water-stress experiments (right column graphs, ○). Means of three replicates ± se are shown.
Figure 7
Figure 7
Patterns of gas exchange as a function of CO2 concentration in leaf discs of V. vinifera cv Gordot. Replicates not considered for averaging are depicted separately and differentiated with inner symbols. Major symbols as in Figure 7. Means of three replicates ± se are shown.
Figure 8
Figure 8
Patterns of gas exchange as a function of CO2 concentration in leaf discs of V. vinifera cv Riesling. Replicates not considered for averaging are depicted separately and differentiated with inner symbols. Major symbols as in Figure 7. Means of three replicates ± se are shown.
Figure 9
Figure 9
Patterns of gas exchange as a function of CO2 concentration in leaf discs of V. vinifera cv Chardonnay. Replicates not considered for averaging are depicted separately and are differentiated with inner symbols. Major symbols are as in Figure 7. Means of three replicates ± se are shown.

References

    1. Asada K, Nakano Y. Affinity for oxygen in photoreduction of molecular oxygen and scavenging of hydrogen peroxide in spinach chloroplasts. Photochem Photobiol. 1978;28:917–920.
    1. Badger MR. Photosynthetic oxygen exchange. Annu Rev Plant Physiol. 1985;36:27–53.
    1. Báló B, Lajkó F, Garab G. Effects of chilling on photosynthesis of grapevines. Photosynthetica. 1991;25:227–230.
    1. Berry J, Björkman O. Photosynthetic response and adaptation to temperature in higher plants. Annu Rev Plant Physiol. 1980;31:491–543.
    1. Biehler K, Fock H. Evidence for the contribution of the Mehler-peroxidase reaction in dissipating excess electrons in drought-stressed wheat. Plant Physiol. 1996;112:265–272. - PMC - PubMed

LinkOut - more resources