. 1999 Oct 12;96(21):12186-91.
doi: 10.1073/pnas.96.21.12186.

Auxin-induced K+ channel expression represents an essential step in coleoptile growth and gravitropism

Affiliations

Auxin-induced K+ channel expression represents an essential step in coleoptile growth and gravitropism

K Philippar et al. Proc Natl Acad Sci U S A. .

Abstract

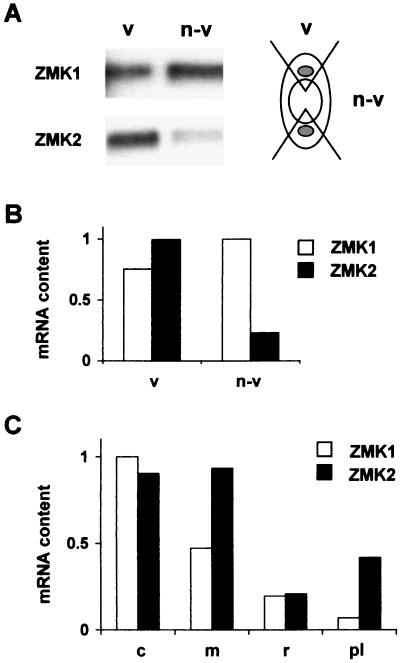
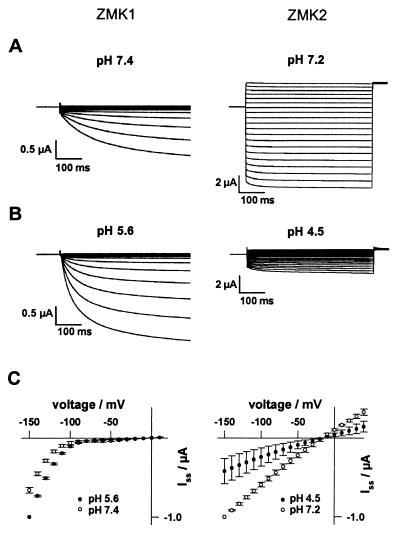
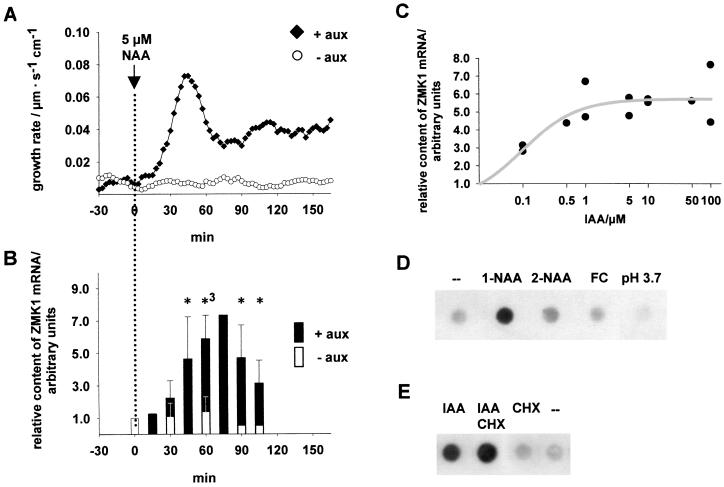
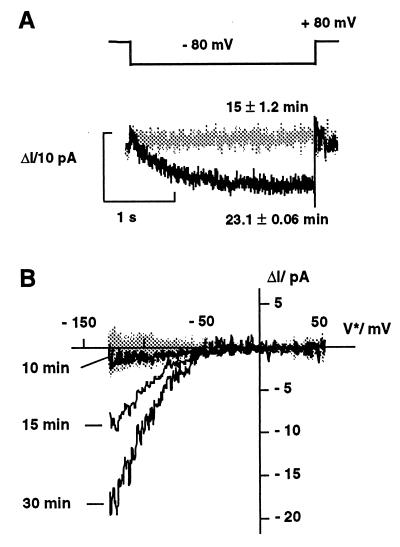
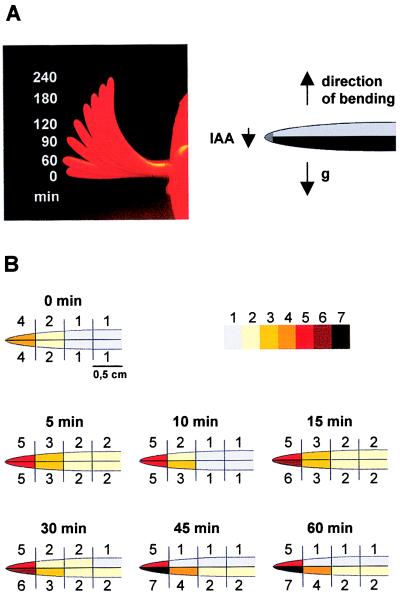
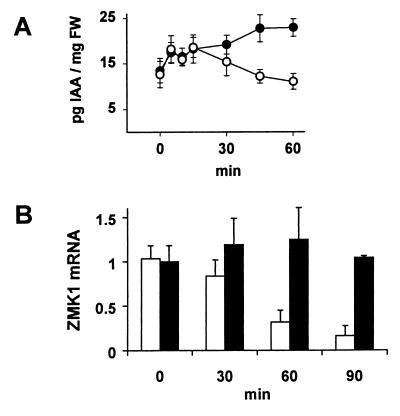
Auxin-induced growth of coleoptiles depends on the presence of potassium and is suppressed by K+ channel blockers. To evaluate the role of K+ channels in auxin-mediated growth, we isolated and functionally expressed ZMK1 and ZMK2 (Zea mays K+ channel 1 and 2), two potassium channels from maize coleoptiles. In growth experiments, the time course of auxin-induced expression of ZMK1 coincided with the kinetics of coleoptile elongation. Upon gravistimulation of maize seedlings, ZMK1 expression followed the gravitropic-induced auxin redistribution. K+ channel expression increased even before a bending of the coleoptile was observed. The transcript level of ZMK2, expressed in vascular tissue, was not affected by auxin. In patch-clamp studies on coleoptile protoplasts, auxin increased K+ channel density while leaving channel properties unaffected. Thus, we conclude that coleoptile growth depends on the transcriptional up-regulation of ZMK1, an inwardly rectifying K+ channel expressed in the nonvascular tissue of this organ.


Figures

Figure 1
Figure 1
Expression pattern of ZMK1 and ZMK2 in maize seedlings. (A Left) Northern blot of 1 μg of mRNA from vascular-enriched (v) and nonvascular (n-v) coleoptile tissues, hybridized against a radiolabeled ZMK1 and ZMK2 cDNA probe. (Right) Scheme of a coleoptile cross-section to illustrate the fragmentation into vascular and nonvascular parts. Notice that vascular-enriched parts contain nonvascular tissue. (B) Relative quantification of ZMK1 and ZMK2 mRNA content in vascular (v) and nonvascular (n-v) coleoptile tissues. Relative mRNA content of ZMK1 (open bars) and ZMK2 (solid bars) was calculated by normalizing ZMK1 and ZMK2 signal density from A as described in Materials and Methods. The transcript content of ZMK2 in vascular tissue was set to 1.0 (arbitrary units). (C) Relative content of ZMK1 and ZMK2 mRNA in seedling tissues. The transcript content, representative of n = 3 experiments, was quantified from the signal density of mRNA dot blots as described. The mRNA content of ZMK1 in coleoptiles was set to 1.0 (arbitrary units). c, coleoptile; m, mesocotyl; r, root; pl, primary leaf.
Figure 2
Figure 2
Voltage dependence and pH sensitivity of ZMK1 and ZMK2 expressed in Xenopus oocytes. (A Left) Inward currents of ZMK1 were elicited in response to 500-ms voltage pulses from +10 mV to −150 mV (10-mV decrements) from a holding potential of −20 mV. (Right) From the zero current potential of ZMK2, 500-ms pulses from +40 mV to −150 mV were applied in 10-mV decrements. (B Left) Upon acidification of the extracellular solution from pH 7.4 to 5.6, ZMK1 currents increased. (Right) Upon acidification from pH 7.2 to 4.5, ZMK2 currents decreased. (C) Steady-state currents (Iss) at the end of the voltage pulses from A (○) and B (●) were normalized to Iss (−150 mV) and plotted against the membrane voltage as mean ± SE (n = 4).
Figure 3
Figure 3
Characterization of the transcriptional induction of ZMK1 by auxin. (A) Kinetics of auxin-induced coleoptile growth. Representative growth curves of abraded coleoptile segments in K+-containing medium in the presence and absence of 5 μM NAA (♦ and ○, respectively). (B) Kinetics of auxin-induced ZMK1 expression. Transcript abundance of ZMK1 in coleoptile segments in the presence and absence of 5 μM NAA (solid and open bars, respectively). The content of ZMK1 mRNA at the given times [n = 3, 75 min (■); n = 1, 90 and 105 min □)] was analyzed by Northern dot blots and quantified as described in Materials and Methods. The transcript contents were normalized to the ZMK1 mRNA level at t = 0 min, which was set to 1.0 (arbitrary units). According to a t test the ZMK1 mRNA content in auxin-treated coleoptiles was significantly different from untreated tissue after 45 min (5% level). The statistical significance is indicated by asterisks (∗, 5% level; ∗3, 0.1% level). (C) Concentration dependence of the auxin-induced ZMK1 expression. Half-logarithmic plot of ZMK1 mRNA content (●) in coleoptile segments after 60 min of incubation with different IAA concentrations (n = 2). The relative content of ZMK1 mRNA was analyzed as described, and the background level of ZMK1 mRNA (0 μM IAA) was set to 1.0 (arbitrary units). The concentration dependence of ZMK1 expression can be fitted with a saturation function (gray line), characterized by a KM of about 0.1 μM IAA. (D) ZMK1 transcription is induced specifically by the active auxin 1-NAA. Shown are Northern dot blots of 0.5 μg mRNA from nontreated (–) coleoptiles and tissues treated for 60 min with 5 μM 1-NAA, 5 μM 2-NAA, and 1 μM FC and incubated in pH 3.7, which were hybridized against a radiolabeled ZMK1 probe. (E) Auxin-induced transcription of ZMK1 is cycloheximide-independent. Shown are Northern dot blots of 0.5 μg mRNA from coleoptiles treated for 60 min with 5 μM IAA (IAA), 5 μM IAA, 70 μM CHX (IAA CHX), and 70 μM CHX (CHX) and nontreated tissue (–), which were hybridized against a radiolabeled ZMK1 probe.
Figure 4
Figure 4
Auxin-induced increase in K+ channel density in coleoptile protoplasts. (A) In the cell-attached mode, K+ currents increased after the addition of 10 μM 1-NAA after a voltage step from +80 mV to −80 mV. Auxin-evoked currents (ΔI) were obtained by subtracting the mean current response (Im) over 7 min before the addition of auxin (n = 12) from Im collected 15 min (gray trace, n = 6) and 23 min (black trace, n = 8) after auxin treatment. With incubation times ≥23 min, auxin induces a time-dependent inward conductance. (B) Development of the K+-inward conductance in response to 10 μM 1-NAA. In the presence of auxin, repetitive voltage ramps (n = 14) monitor the increase in K+ current at times ≥15 min. In the absence of auxin only background currents were recorded (shaded area). Each trace in A and B represents the mean of n voltage ramps averaged.
Figure 5
Figure 5
Coleoptile bending and redistribution of endogenous IAA concentration in response to gravistimulation. (A Left) Time-dependent coleoptile bending (0–240 min) in response to a 90° gravistimulation. (Right) Cartoon of a gravistimulated coleoptile. (B) IAA concentration (pg IAA/mg fresh weight, mean of n = 3 experiments) in 0.5-cm segments of coleoptile halves, gravistimulated for 0, 5, 10, 15, 30, 45, and 60 min. The IAA spectrum was decomposed into seven concentration ranges and highlighted by a color code. 1, 10.8–13.9 ± 3.0; 2, 14.1–17.9 ± 3.3; 3, 19.9–23.5 ± 5.5; 4, 16.9–31.2 ± 5.9; 5, 34.6–42.5 ± 7.6; 6, 48.7–49.4 ± 6.5; 7, 51.1–58.8 ± 8.0 pg IAA/mg fresh weight.
Figure 6
Figure 6
Kinetics of IAA redistribution and differential ZMK1 expression during gravistimulation of coleoptiles. (A) Time-dependent IAA redistribution in upper (○) and lower (●) coleoptile halves after gravistimulation. The figure shows the IAA concentration per mg fresh weight (FW, n = 3 ± SE) in segments 0.5–1.5 cm behind the tip (compare with Fig. 5B). (B) Relative transcript content of ZMK1 in upper (open bars) and lower (solid bars) coleoptile halves 0.5–1.5 cm behind the tip after 0, 30, 60, and 90 min of gravistimulation. The mRNA content (n = 3 ± SE) was quantified as described in Materials and Methods. The level of ZMK1 mRNA in the upper half at t = 0 min was set to 1.0 (arbitrary units).

References

    1. Felle H, Peters W, Palme K. Biochim Biophys Acta. 1991;1064:199–204. - PubMed
    1. Lohse G, Hedrich R. Planta. 1992;188:206–214. - PubMed
    1. Hager A, Debus G, Edel H G, Stransky H, Serrano R. Planta. 1991;185:527–537. - PubMed
    1. McClure B A, Guilfoyle T. Science. 1989;243:91–93. - PubMed
    1. Abel S, Oeller P W, Theologis A. Proc Natl Acad Sci USA. 1994;91:326–330. - PMC - PubMed

Publication types

MeSH terms

LinkOut - more resources