. 1999 Oct 1;13(19):2514-26.
doi: 10.1101/gad.13.19.2514.

Cleavage of the death domain kinase RIP by caspase-8 prompts TNF-induced apoptosis

Affiliations

Cleavage of the death domain kinase RIP by caspase-8 prompts TNF-induced apoptosis

Y Lin et al. Genes Dev. .

Abstract

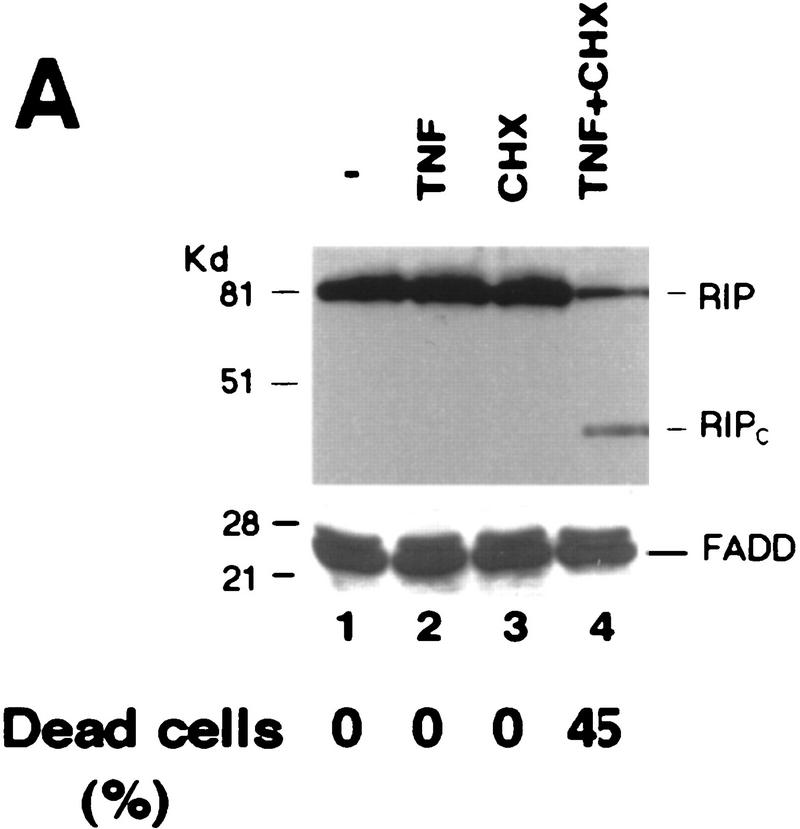
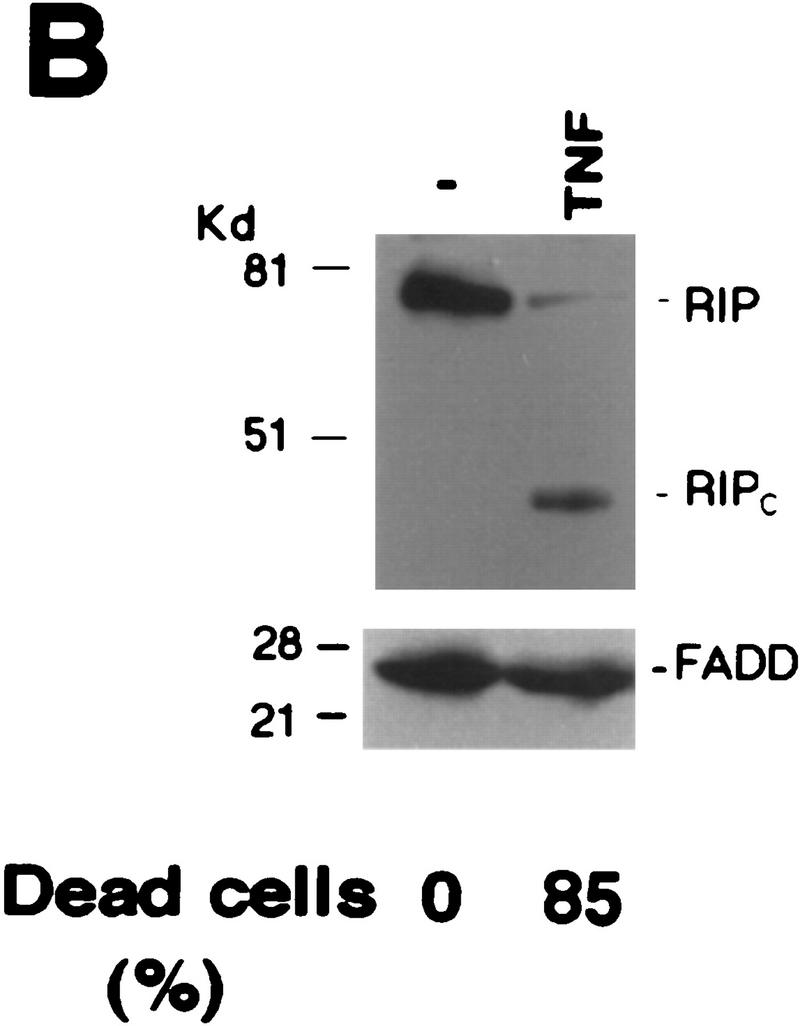
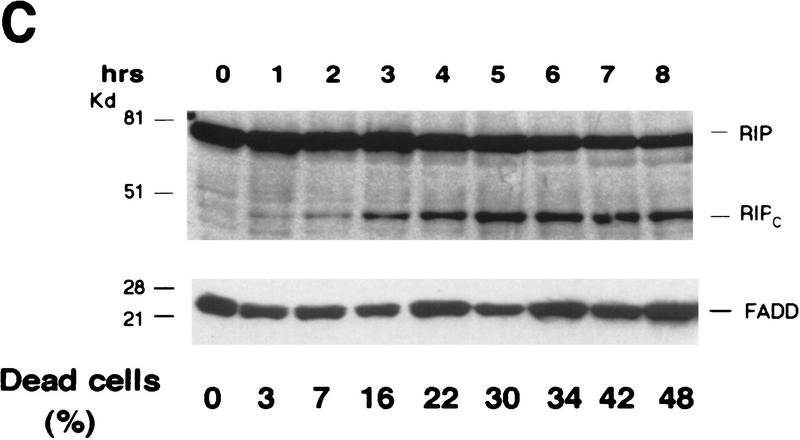
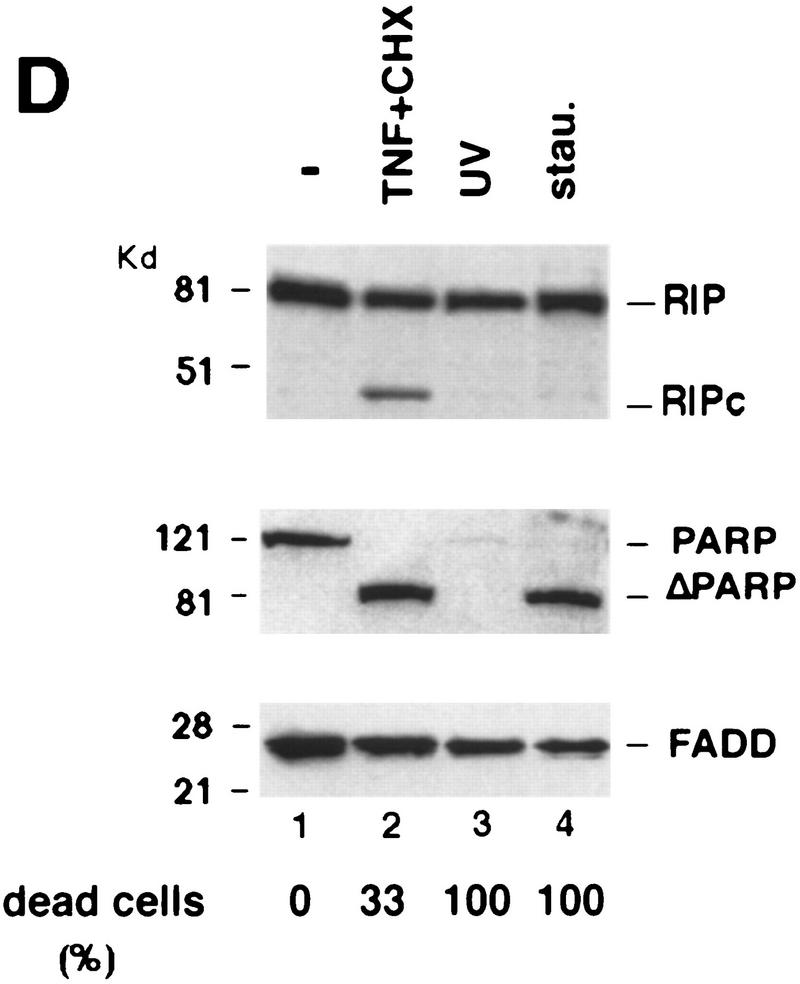
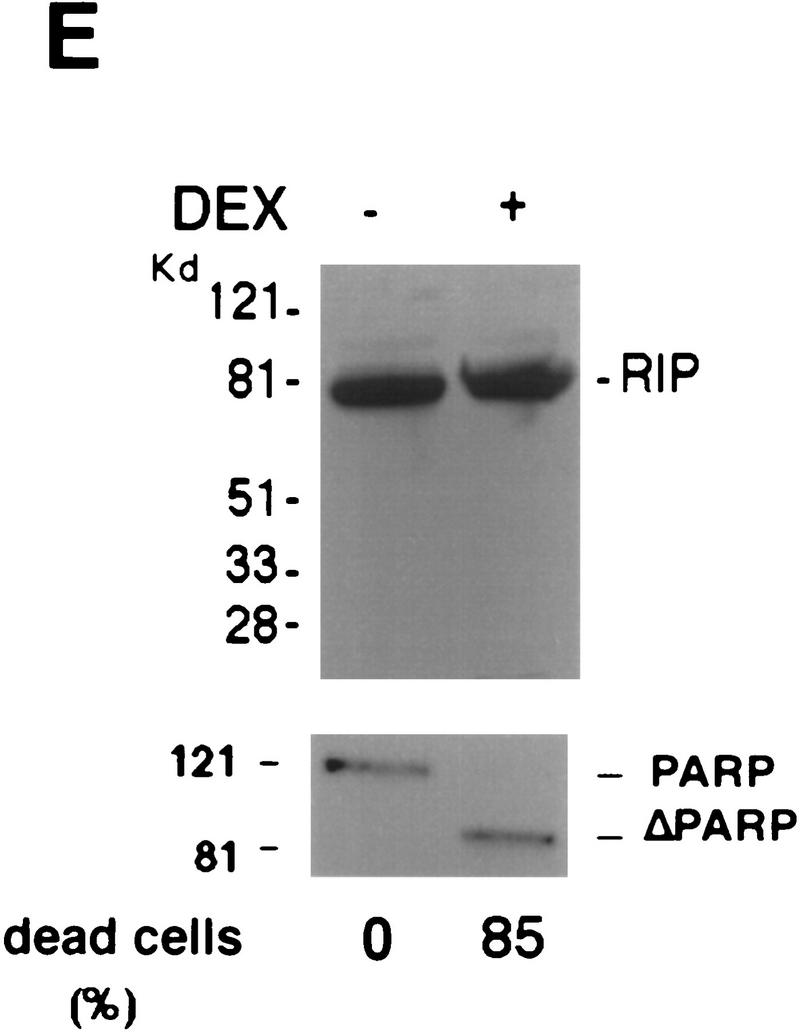
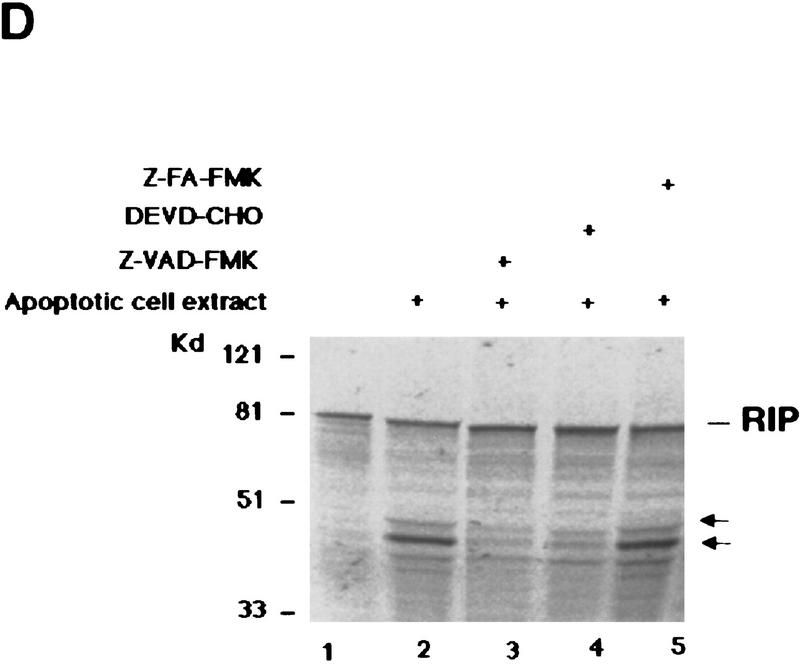
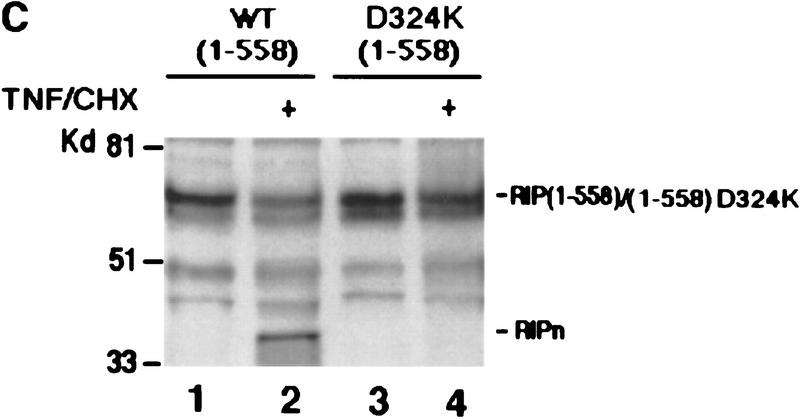
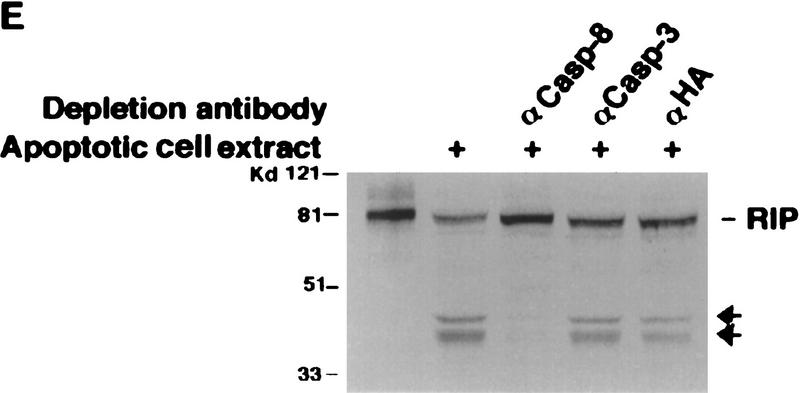
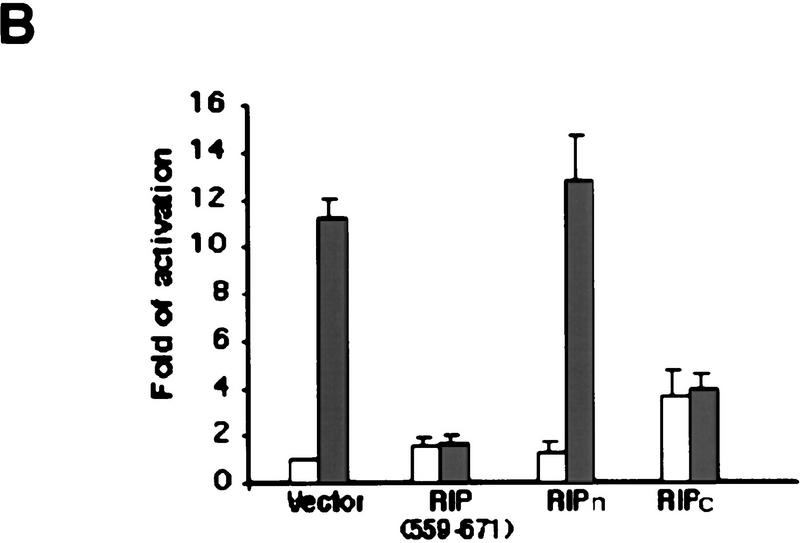
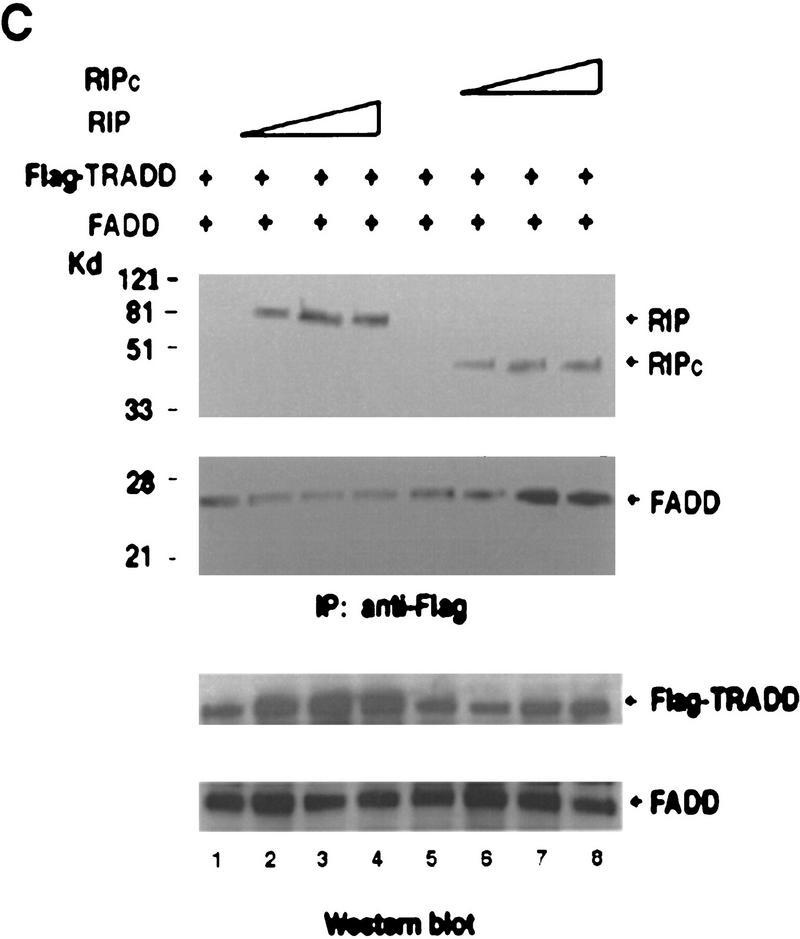
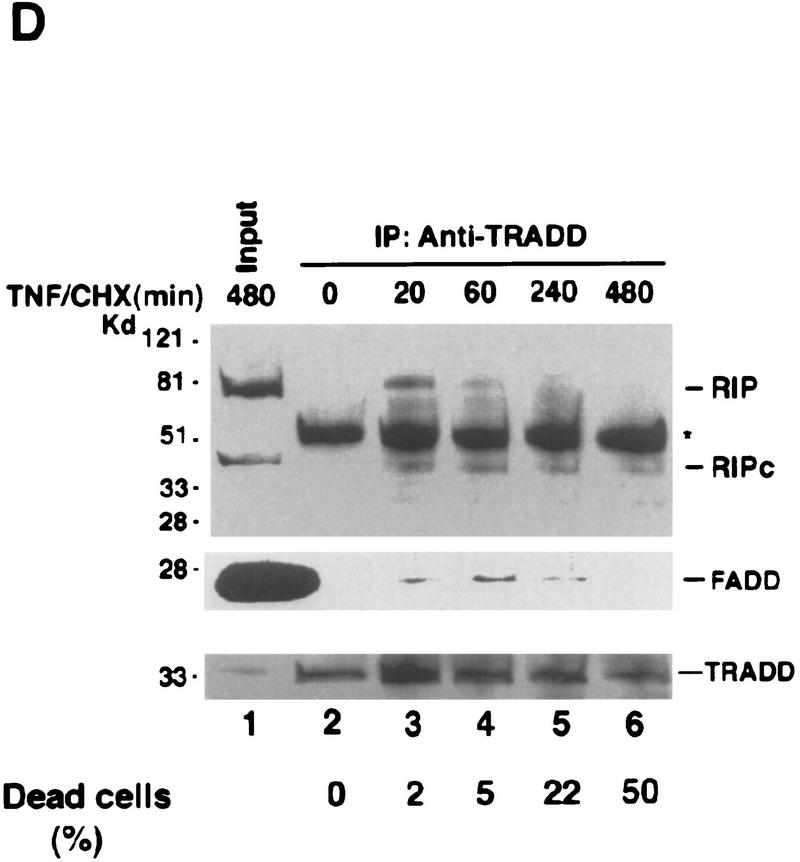
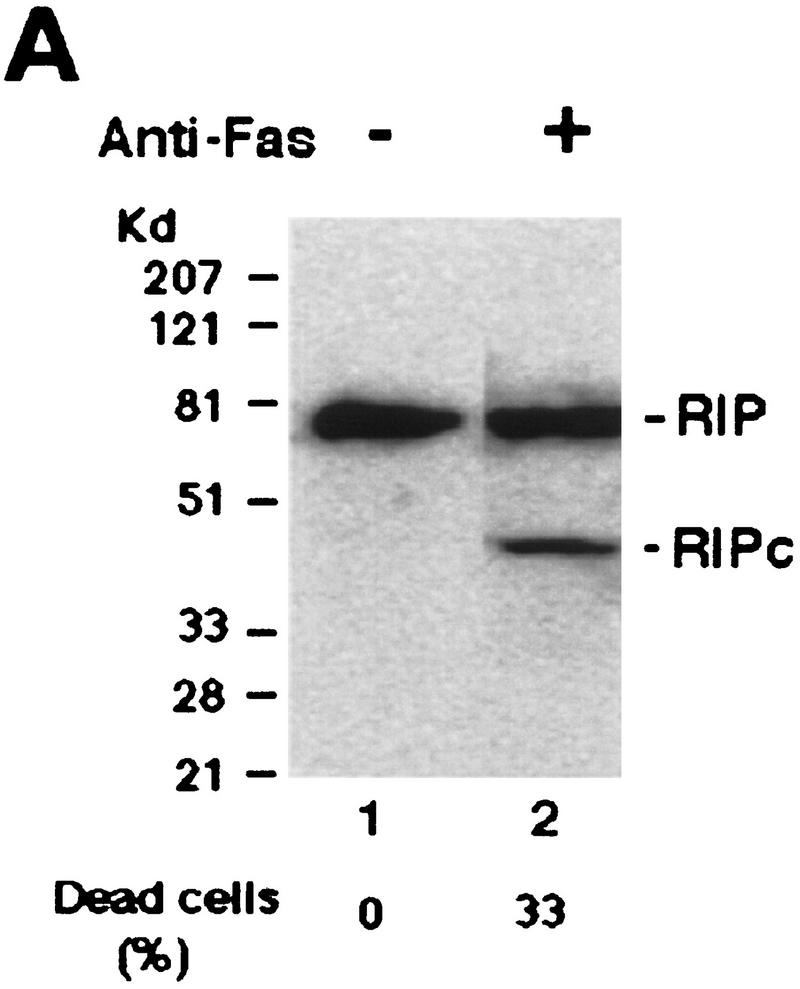
Although the molecular mechanisms of TNF signaling have been largely elucidated, the principle that regulates the balance of life and death is still unknown. We report here that the death domain kinase RIP, a key component of the TNF signaling complex, was cleaved by Caspase-8 in TNF-induced apoptosis. The cleavage site was mapped to the aspartic acid at position 324 of RIP. We demonstrated that the cleavage of RIP resulted in the blockage of TNF-induced NF-kappaB activation. RIPc, one of the cleavage products, enhanced interaction between TRADD and FADD/MORT1 and increased cells' sensitivity to TNF. Most importantly, the Caspase-8 resistant RIP mutants protected cells against TNF-induced apopotosis. These results suggest that cleavage of RIP is an important process in TNF-induced apoptosis. Further more, RIP cleavage was also detected in other death receptor-mediated apoptosis. Therefore, our study provides a potential mechanism to convert cells from life to death in death receptor-mediated apoptosis.


Figures

Figure 1
Figure 1
Cleavage of RIP in TNF-induced apoptosis. (A) HeLa cells were treated with TNF (15 ng/ml) (lane 2); CHX (10 μg/ml) (lane 3); or TNF (15 ng/ml) + CHX (10 μg/ml) (lane 4) for 10 hr. Cell extracts were resolved on SDS-PAGE and then Western blotted for RIP (top) and FADD (bottom). Untreated cell extract was loaded as a control (lane 1). (B) MCF7 cells were treated with TNF (15 ng/ml) for 18 hr. RIP and FADD were detected by Western blot. (C) Time course of RIP cleavage in TNF induced apoptosis in HeLa cells. Cells were treated with TNF (15 ng/ml) + CHX (10 μg/ml) and incubated for the indicated time periods. RIP and FADD were detected by Western blot analysis. (D) HeLa cells were treated with TNF (15 ng/ml) + CHX (10 μg/ml) for 6 hr (lane 2); UVC (20 J/m2, followed by overnight culture) (lane 3); and staurosporine (1 μm) overnight (lane 4). Cell extracts were resolved on SDS-PAGE and Western blotted for RIP (top), PARP (middle), and FADD (bottom). Untreated cell extract was loaded as a control (lane 1). (E) 2B4 cells were treated with DEX (1 μm) for 10 hr, and RIP and PARP were detected by Western blot analysis. Cell death was determined by trypan blue exclusion staining. The percentages of dead cells are at the bottom of the panels. Data are normalized to the rate of spontaneous cell death occurring in untreated cells (<5%). The positions of the molecular mass markers are indicated in kD at left of panels.
Figure 1
Figure 1
Cleavage of RIP in TNF-induced apoptosis. (A) HeLa cells were treated with TNF (15 ng/ml) (lane 2); CHX (10 μg/ml) (lane 3); or TNF (15 ng/ml) + CHX (10 μg/ml) (lane 4) for 10 hr. Cell extracts were resolved on SDS-PAGE and then Western blotted for RIP (top) and FADD (bottom). Untreated cell extract was loaded as a control (lane 1). (B) MCF7 cells were treated with TNF (15 ng/ml) for 18 hr. RIP and FADD were detected by Western blot. (C) Time course of RIP cleavage in TNF induced apoptosis in HeLa cells. Cells were treated with TNF (15 ng/ml) + CHX (10 μg/ml) and incubated for the indicated time periods. RIP and FADD were detected by Western blot analysis. (D) HeLa cells were treated with TNF (15 ng/ml) + CHX (10 μg/ml) for 6 hr (lane 2); UVC (20 J/m2, followed by overnight culture) (lane 3); and staurosporine (1 μm) overnight (lane 4). Cell extracts were resolved on SDS-PAGE and Western blotted for RIP (top), PARP (middle), and FADD (bottom). Untreated cell extract was loaded as a control (lane 1). (E) 2B4 cells were treated with DEX (1 μm) for 10 hr, and RIP and PARP were detected by Western blot analysis. Cell death was determined by trypan blue exclusion staining. The percentages of dead cells are at the bottom of the panels. Data are normalized to the rate of spontaneous cell death occurring in untreated cells (<5%). The positions of the molecular mass markers are indicated in kD at left of panels.
Figure 2
Figure 2
RIP is cleaved by a caspase. (A) HeLa cells were pre-treated with 10 μm of DEVD–CHO (lane 4) or Z–VAD–FMK (lane 3) for 1 hr, or left untreated (lanes 1,2). This was followed by treatment with TNF (15 ng/ml) + CHX (10 μg/ml) (lanes 24) for 6 hr. Cell extracts were resolved on SDS-PAGE and Western blotted for RIP (top), PARP (middle), and FADD (bottom). Untreated cells extract was loaded as a control (lane 1). The percentages of dead cells are at the bottom of the panel. (B) 35S-Labeled RIP protein was incubated with apoptotic (lane 3) or normal (lane 2) HeLa cell extracts at 30°C for 3 hr, resolved on SDS-PAGE, and visualized by autoradiography. Nontreated RIP protein was loaded as a control (lane 1). The resultant cleavage products are indicated with arrows. (C) 35S-Labeled Myc-tagged RIP protein was incubated with RIP-depleted apoptotic (lane 6) or normal (lane 5) HeLa cell extracts at 30°C for 3 hr, transferred onto a nitrocellular filter, visualized by autoradiograph, and probed with anti-RIP and anti-Myc to detect the carboxy- and amino-terminal portion of RIP, respectively. Nontreated RIP protein was loaded as a control (lane 4). The resultant cleavage products are indicated with arrows. The normal and apoptotic (with or without RIP depletion) HeLa cell extracts were loaded as controls (lanes 13). (D) Apoptotic cell extracts were preincubated with 10 μm of DEVD–CHO (lane 4), Z–VAD–FMK (lane 3), or Z–FA–FMK (lane 5) for 15 min, mixed with 35S-labeled RIP protein, and incubated at 30°C for 3 hr. The result was visualized by autoradiograph. The resultant cleavage products are indicated with arrows. The positions of the molecular mass markers are indicated in kD at left of panels.
Figure 2
Figure 2
RIP is cleaved by a caspase. (A) HeLa cells were pre-treated with 10 μm of DEVD–CHO (lane 4) or Z–VAD–FMK (lane 3) for 1 hr, or left untreated (lanes 1,2). This was followed by treatment with TNF (15 ng/ml) + CHX (10 μg/ml) (lanes 24) for 6 hr. Cell extracts were resolved on SDS-PAGE and Western blotted for RIP (top), PARP (middle), and FADD (bottom). Untreated cells extract was loaded as a control (lane 1). The percentages of dead cells are at the bottom of the panel. (B) 35S-Labeled RIP protein was incubated with apoptotic (lane 3) or normal (lane 2) HeLa cell extracts at 30°C for 3 hr, resolved on SDS-PAGE, and visualized by autoradiography. Nontreated RIP protein was loaded as a control (lane 1). The resultant cleavage products are indicated with arrows. (C) 35S-Labeled Myc-tagged RIP protein was incubated with RIP-depleted apoptotic (lane 6) or normal (lane 5) HeLa cell extracts at 30°C for 3 hr, transferred onto a nitrocellular filter, visualized by autoradiograph, and probed with anti-RIP and anti-Myc to detect the carboxy- and amino-terminal portion of RIP, respectively. Nontreated RIP protein was loaded as a control (lane 4). The resultant cleavage products are indicated with arrows. The normal and apoptotic (with or without RIP depletion) HeLa cell extracts were loaded as controls (lanes 13). (D) Apoptotic cell extracts were preincubated with 10 μm of DEVD–CHO (lane 4), Z–VAD–FMK (lane 3), or Z–FA–FMK (lane 5) for 15 min, mixed with 35S-labeled RIP protein, and incubated at 30°C for 3 hr. The result was visualized by autoradiograph. The resultant cleavage products are indicated with arrows. The positions of the molecular mass markers are indicated in kD at left of panels.
Figure 3
Figure 3
Mapping of the caspase cleavage site in RIP. (A) Schematic illustration of substitution mutants of RIP constructs. The kinase and death domains of RIP are shown as shaded and solid bars, respectively. The amino acid substitutions of each mutant are indicated. (B) 35S-Labeled RIP proteins were incubated with apoptotic HeLa cell extract (lanes 3,6,9,12) or normal HeLa cell extract (lanes 2,5,8,11) at 30°C for 3 hr, resolved on SDS-PAGE and visualized by autoradiograph. Nontreated RIP proteins were loaded as controls (lanes 1,4,7,10). (Lanes 13) Wild-type RIP; (lanes 46) RIP(D324K); (lanes 79) RIP (D248A, D250A, D252P); (lanes 1012) RIP(D300V). The resultant cleaving products are indicated with arrows. (C) HeLa cells were transfected with Myc-tagged RIP(1–558) (lanes 1,2) or RIP(1–558, D324K) (lanes 3,4). Cells were treated with TNF + CHX (lanes 2,4) or remained untreated (lanes 1,3). Myc-tagged RIP proteins were detected by Western blot analysis with anti-Myc antibody. The position of Myc-tagged RIP (1–558)/ RIP (1–558, D324K) is indicated. RIPn indicates the resultant Myc-tagged amino-terminal portion of RIP (1–324 amino acids). (D) 35S-Labeled RIP proteins were incubated with Caspase-3 (lanes 2,6), Caspase-8 (lanes 3,7), or apoptotic HeLa cell extract at 37°C for 2 hr, resolved on SDS-PAGE and visualized by autoradiograph. Nontreated RIP proteins were loaded as controls (lanes 1,5). The resultant cleavage products are indicated with arrowheads. (E) Fifty microliters of apoptotic cell extract was incubated with the indicated antibodies bound on protein A resin at 4°C for 12 hr. The resin was removed by centrifugation and the supernatants were applied in cleavage assays as described in B. The positions of the molecular mass markers are indicated in kD at left of panels.
Figure 3
Figure 3
Mapping of the caspase cleavage site in RIP. (A) Schematic illustration of substitution mutants of RIP constructs. The kinase and death domains of RIP are shown as shaded and solid bars, respectively. The amino acid substitutions of each mutant are indicated. (B) 35S-Labeled RIP proteins were incubated with apoptotic HeLa cell extract (lanes 3,6,9,12) or normal HeLa cell extract (lanes 2,5,8,11) at 30°C for 3 hr, resolved on SDS-PAGE and visualized by autoradiograph. Nontreated RIP proteins were loaded as controls (lanes 1,4,7,10). (Lanes 13) Wild-type RIP; (lanes 46) RIP(D324K); (lanes 79) RIP (D248A, D250A, D252P); (lanes 1012) RIP(D300V). The resultant cleaving products are indicated with arrows. (C) HeLa cells were transfected with Myc-tagged RIP(1–558) (lanes 1,2) or RIP(1–558, D324K) (lanes 3,4). Cells were treated with TNF + CHX (lanes 2,4) or remained untreated (lanes 1,3). Myc-tagged RIP proteins were detected by Western blot analysis with anti-Myc antibody. The position of Myc-tagged RIP (1–558)/ RIP (1–558, D324K) is indicated. RIPn indicates the resultant Myc-tagged amino-terminal portion of RIP (1–324 amino acids). (D) 35S-Labeled RIP proteins were incubated with Caspase-3 (lanes 2,6), Caspase-8 (lanes 3,7), or apoptotic HeLa cell extract at 37°C for 2 hr, resolved on SDS-PAGE and visualized by autoradiograph. Nontreated RIP proteins were loaded as controls (lanes 1,5). The resultant cleavage products are indicated with arrowheads. (E) Fifty microliters of apoptotic cell extract was incubated with the indicated antibodies bound on protein A resin at 4°C for 12 hr. The resin was removed by centrifugation and the supernatants were applied in cleavage assays as described in B. The positions of the molecular mass markers are indicated in kD at left of panels.
Figure 4
Figure 4
Effects of RIP cleavage on NF-κB activation and TRADD/FADD interaction. (A) Cells were co-transfected with p2xNF-κB–Luc, pRSV–lacZ and different RIP constructs as indicated or an empty vector. In the experiments described in the right panel, the expression vector of CrmA was also included. Twenty-four hours post-transfection, the cells were collected. Luciferase assay was conducted and normalized as described (Liu et al. 1996). The results were the average of three duplicated experiments. (B) Cells were cotransfected with p2xNF-κB–Luc, CrmA and different RIP constructs. Twenty-four hours post-transfection, half of the cells were treated with TNF (15 ng/ml) for 10 hr (solid bars). (Open bars) Nontreated cells. Luciferase activities were detected and normalized. The results shown were the average of three duplicated experiments. (C) HEK293 cells were cotransfected with FLAG–TRADD (2.5 μg), FADD (2.5 μg), CrmA (1 μg), along with increasing amounts of Xpress-tagged RIP (1.5, 3, 4.5 μg in lanes 2, 3, and 4, respectively) or RIPc (1.5, 3, 4.5 μg in lanes 6, 7, and 8, respectively). The total amount of DNA in each transfection was adjusted to 10 μg with the empty vector. Cells were collected at 24 hr after transfection. Expressions of Flag–TRADD and FADD were determined by Western blot (bottom). Immunoprecipitation experiments were performed with anti-Flag (M2) antibody, and coprecipitated FADD and Xpress-tagged RIP proteins were detected by Western blotting with anti-FADD and anti-Xpress, respectively (top). (D). HeLa cells (2 × 107) were treated with TNF (15 ng/ml) + CHX (10 μg/ml) for the indicated time periods, immunoprecipitation experiments were performed with anti-TRADD antibody, and coprecipitated RIP, FADD, and TRADD proteins were detected by Western blot. (Lane 1) One percent of the cell extract from the 480-min sample as an input control. The blot of FADD was exposed for a longer time to visualize the precipitated FADD protein. Cell death was determined by trypan blue exclusion staining. The percentages of dead cells are shown at the bottom of the panel. The positions of the molecular mass markers are indicated in kD on the left of C and D. (*IgG heavy chain).
Figure 4
Figure 4
Effects of RIP cleavage on NF-κB activation and TRADD/FADD interaction. (A) Cells were co-transfected with p2xNF-κB–Luc, pRSV–lacZ and different RIP constructs as indicated or an empty vector. In the experiments described in the right panel, the expression vector of CrmA was also included. Twenty-four hours post-transfection, the cells were collected. Luciferase assay was conducted and normalized as described (Liu et al. 1996). The results were the average of three duplicated experiments. (B) Cells were cotransfected with p2xNF-κB–Luc, CrmA and different RIP constructs. Twenty-four hours post-transfection, half of the cells were treated with TNF (15 ng/ml) for 10 hr (solid bars). (Open bars) Nontreated cells. Luciferase activities were detected and normalized. The results shown were the average of three duplicated experiments. (C) HEK293 cells were cotransfected with FLAG–TRADD (2.5 μg), FADD (2.5 μg), CrmA (1 μg), along with increasing amounts of Xpress-tagged RIP (1.5, 3, 4.5 μg in lanes 2, 3, and 4, respectively) or RIPc (1.5, 3, 4.5 μg in lanes 6, 7, and 8, respectively). The total amount of DNA in each transfection was adjusted to 10 μg with the empty vector. Cells were collected at 24 hr after transfection. Expressions of Flag–TRADD and FADD were determined by Western blot (bottom). Immunoprecipitation experiments were performed with anti-Flag (M2) antibody, and coprecipitated FADD and Xpress-tagged RIP proteins were detected by Western blotting with anti-FADD and anti-Xpress, respectively (top). (D). HeLa cells (2 × 107) were treated with TNF (15 ng/ml) + CHX (10 μg/ml) for the indicated time periods, immunoprecipitation experiments were performed with anti-TRADD antibody, and coprecipitated RIP, FADD, and TRADD proteins were detected by Western blot. (Lane 1) One percent of the cell extract from the 480-min sample as an input control. The blot of FADD was exposed for a longer time to visualize the precipitated FADD protein. Cell death was determined by trypan blue exclusion staining. The percentages of dead cells are shown at the bottom of the panel. The positions of the molecular mass markers are indicated in kD on the left of C and D. (*IgG heavy chain).
Figure 5
Figure 5
Effects of RIP cleavage on apoptosis. (A) HeLa cells were cotransfected with pRSV–LacZ and different RIP constructs with (open bars) or without CrmA (solid bars) as indicated. Twenty-four hours post-transfection, the cells were fixed and stained with X-gal. Viable blue cells, determined by their sizes and shapes, were counted from 20 randomly selected fields. Data shown represent three independent experiments. The difference of viable cells of wild-type RIP vs. RIP (D324K) transfection is statistically significant (P < 0.005). (B) Duplicates of MCF7 cells were cotransfected with pRSV–LacZ and different RIP constructs. Twenty-four hours post-transfection, half of the cells were treated with 15 ng/ml TNF for 18 hr and then fixed and stained with X-gal. Alive blue cells were counted from 20 randomly selected fields for each sample. Percentage of viable cells for each plasmid was calculated by dividing the number of viable transfected cells after treatment with the number of viable transfected cells before treatment. Data shown represent three independent experiments. The differences of viable cells of wild-type versus RIP (D324K) and RIPc versus vector transfections are statistically significant (both P < 0.05). (C) MCF7 cells were cotransfected with pRSV–LacZ and different RIP constructs as indicated. Cells were treated and counted as described in B. The difference of viable cells of wild-type vs. RIP (D324K) transfection is statistically significant (P < 0.005).
Figure 6
Figure 6
Cleavage of RIP in Fas and TRAIL induced apoptosis. (A) Jurkat cells were treated with anti-Fas (IgM, 250 ng/ml) for 6 hr (lane 2) and RIP protein was detected by Western blot analysis. (Lane 1) Untreated cell extract. The percentages of dead cells were shown at the bottom of the panel. (B) HeLa cells were treated with TRAIL (0.5 μg/ml) for 2 hr (lane 2) and RIP protein was detected by Western blot analysis. (Lane 1) Untreated cell extract. The percentages of dead cells are shown at the bottom of the panel. The positions of the molecular weight markers are indicated in kD at left. (C) Wild-type or RIP-deficient Jurkat cells were treated with TNF (15 ng/ml) + CHX (10 μg/ml), TRAIL (0.5 μg/ml), anti-Fas (250 ng/ml), or UVC (20J/m2), and followed by 6 hr culture. Cell death was determined by trypan blue exclusion staining. The percentages of dead cells shown are the average of three independent experiments. The probabilities in these experiments between wild-type RIP (open bars) and RIP (solid bars) cells are nontreated, >0.9; TNF/CHX, <0.025; TRAIL, <0.025; Fas, <0.005; and UV, >0.1.
Figure 6
Figure 6
Cleavage of RIP in Fas and TRAIL induced apoptosis. (A) Jurkat cells were treated with anti-Fas (IgM, 250 ng/ml) for 6 hr (lane 2) and RIP protein was detected by Western blot analysis. (Lane 1) Untreated cell extract. The percentages of dead cells were shown at the bottom of the panel. (B) HeLa cells were treated with TRAIL (0.5 μg/ml) for 2 hr (lane 2) and RIP protein was detected by Western blot analysis. (Lane 1) Untreated cell extract. The percentages of dead cells are shown at the bottom of the panel. The positions of the molecular weight markers are indicated in kD at left. (C) Wild-type or RIP-deficient Jurkat cells were treated with TNF (15 ng/ml) + CHX (10 μg/ml), TRAIL (0.5 μg/ml), anti-Fas (250 ng/ml), or UVC (20J/m2), and followed by 6 hr culture. Cell death was determined by trypan blue exclusion staining. The percentages of dead cells shown are the average of three independent experiments. The probabilities in these experiments between wild-type RIP (open bars) and RIP (solid bars) cells are nontreated, >0.9; TNF/CHX, <0.025; TRAIL, <0.025; Fas, <0.005; and UV, >0.1.
Figure 7
Figure 7
Regulation of TNF-R1signaling pathways during apoptosis. When cells undergo TNF-induced apoptosis, RIP is cleaved by Caspase-8. Although cleavage of BID and other caspases activates death pathways, cleavage of RIP neutralizes the protective effect of NF-κB. RIP mediates TNF-induced NF-κB activation through IκB kinase (IKK) (Baeuerle and Baltimore 1996) and TRAF2 transduces TNF signaling by activating MEKK/JNKK/JNK pathway (Liu et al. 1996).

References

    1. Ashkenazi A, Dixit VM. Death receptors: Signaling and modulation. Science. 1998;281:1305–1308. - PubMed
    1. Baeuerle PA. IκB-NF-κB structures: At the interface of inflammation control. Cell. 1998;95:729–731. - PubMed
    1. Baeuerle PA, Baltimore D. NF-κB: Ten years after. Cell. 1996;87:13–20. - PubMed
    1. Baker SJ, Reddy EP. Modulation of life and death by the TNF receptor superfamily. Oncogene. 1998;17:3261–3270. - PubMed
    1. Beg AA, Baltimore D. An essential role for NF-κB in preventing TNFα-induced cell death. Science. 1996;274:782–784. - PubMed

MeSH terms

Substances