. 1999 Oct 15;520 Pt 2(Pt 2):417-29.
doi: 10.1111/j.1469-7793.1999.00417.x.

Intracellular calcium signals measured with indo-1 in isolated skeletal muscle fibres from control and mdx mice

Affiliations

Intracellular calcium signals measured with indo-1 in isolated skeletal muscle fibres from control and mdx mice

C Collet et al. J Physiol. .

Abstract

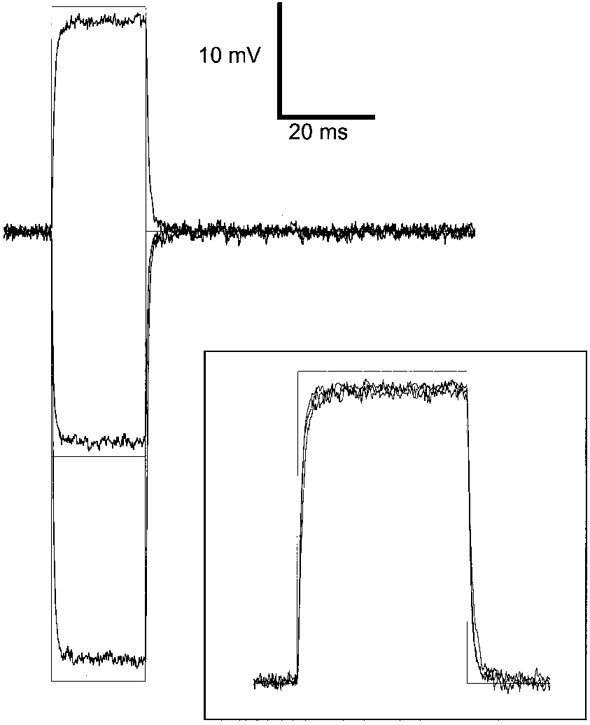
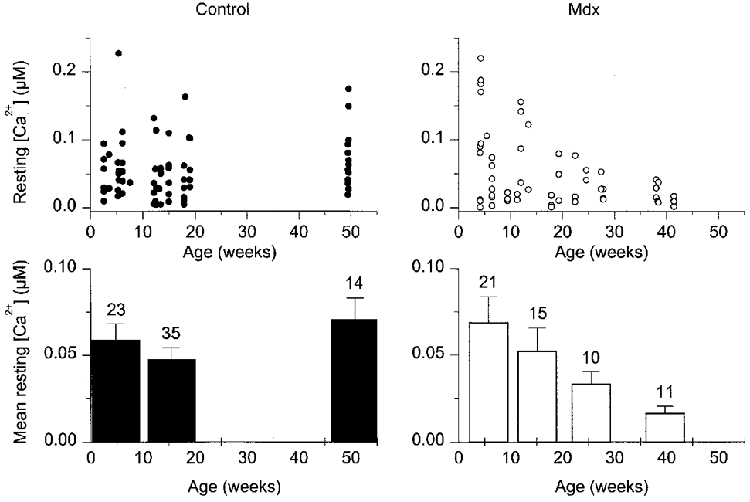
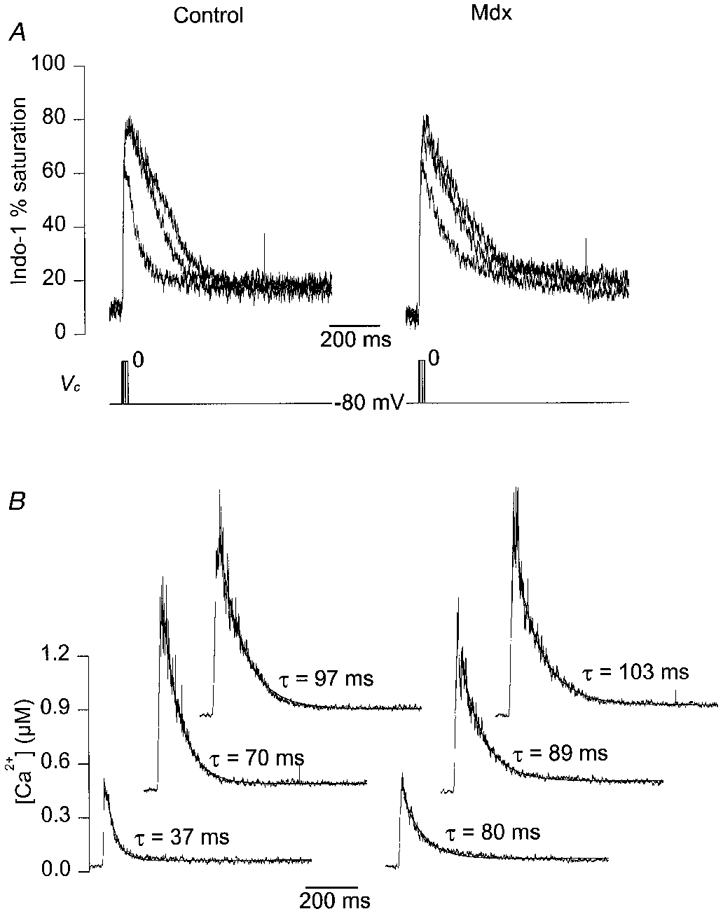
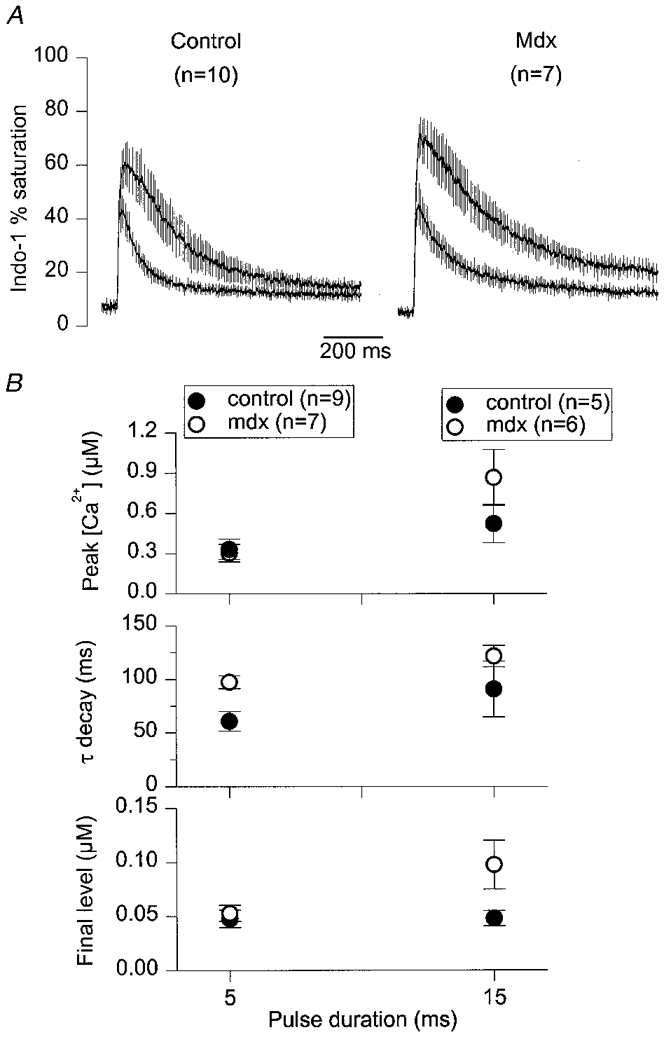
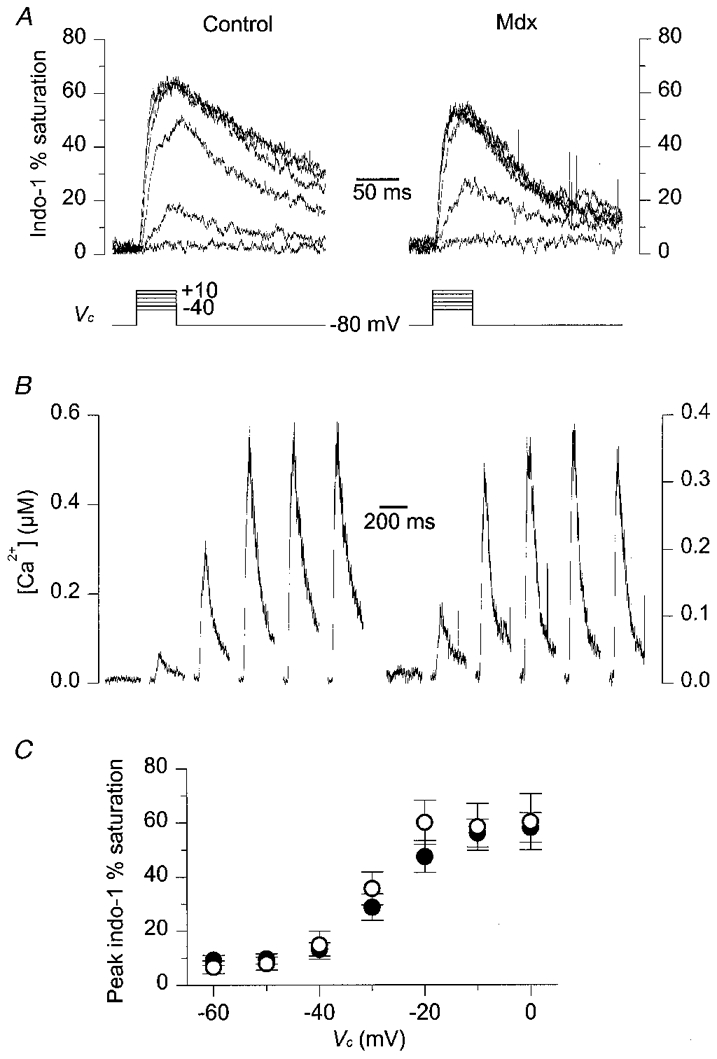
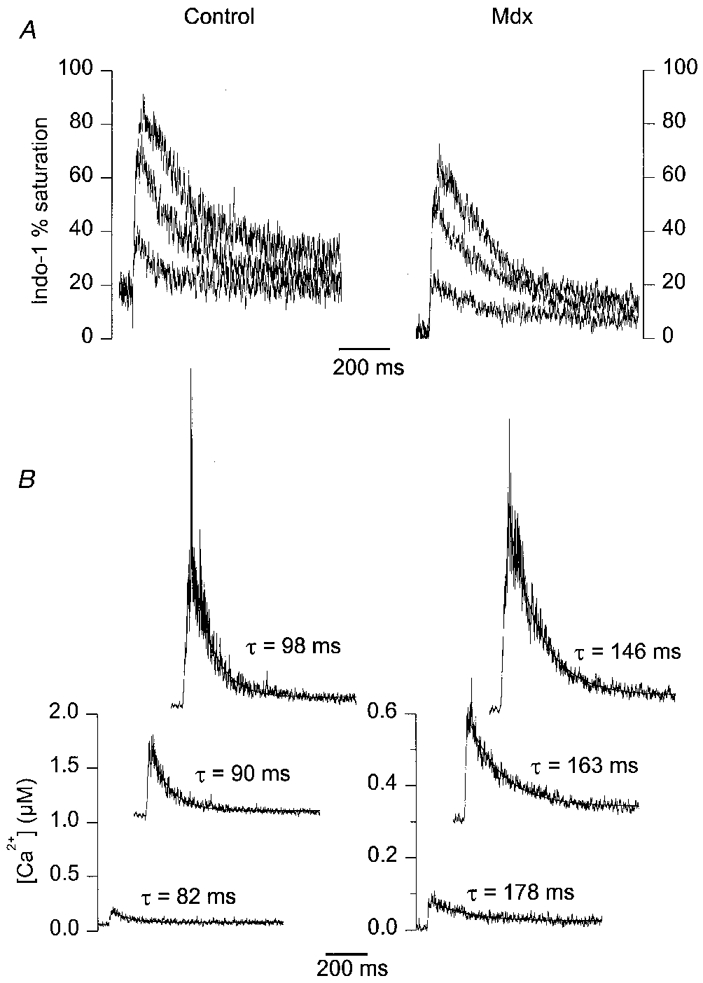
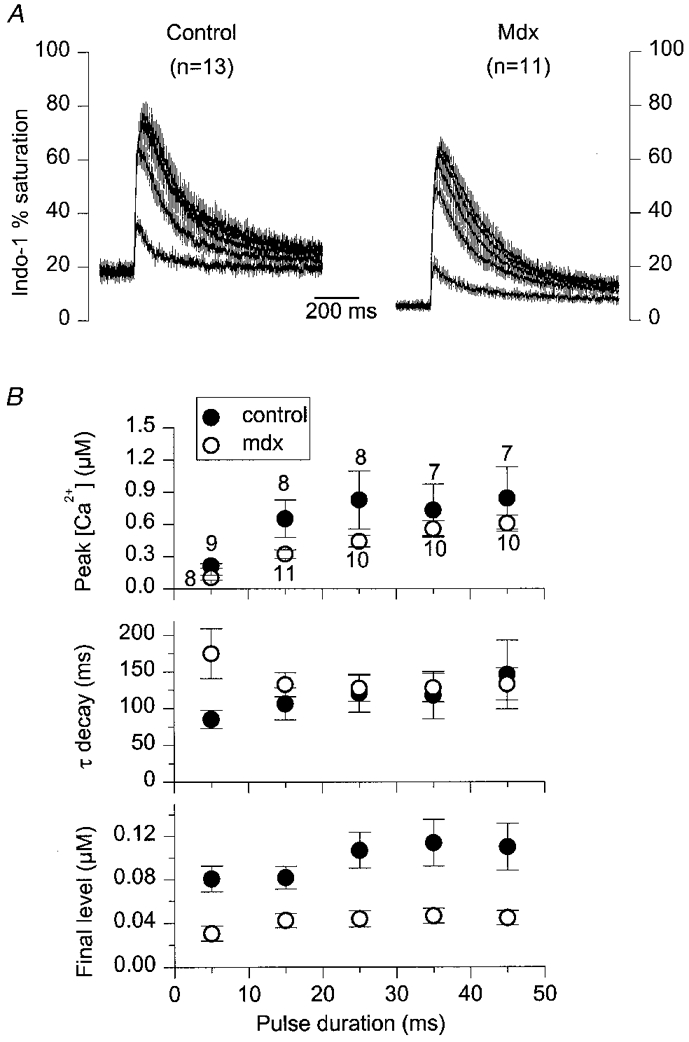
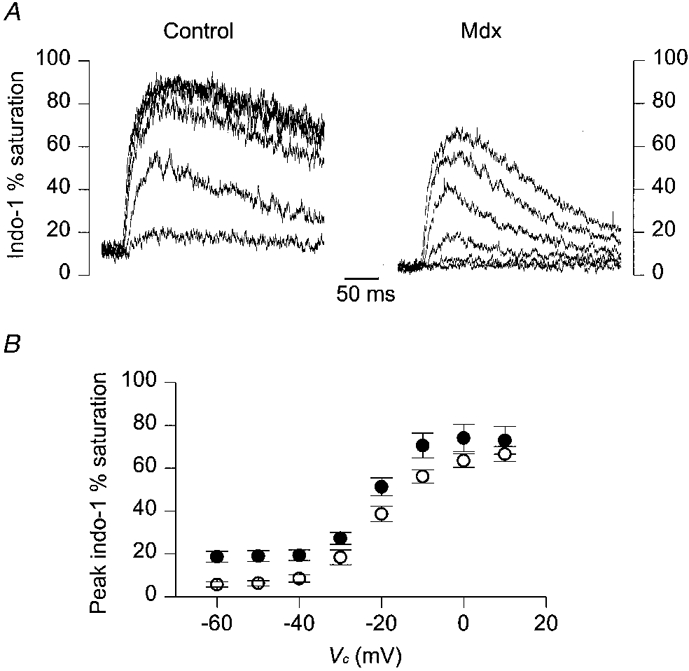
1. Intracellular free calcium concentration ([Ca2+]i) was measured with the fluorescent indicator indo-1 in single skeletal fibres enzymatically isolated from the flexor digitorum brevis and interosseus muscles of control and dystrophic mdx C57BL/10 mice. Measurements were taken from a portion of fibre that was voltage clamped to allow detection of depolarization-induced changes in [Ca2+]i. 2. The mean (+/- s.e.m.) initial resting [Ca2+]i from all control and mdx fibres tested was 56 +/- 5 nM (n = 72) and 48 +/- 7 nM (n = 57), respectively, indicating no significant overall difference between the two groups. However, when comparing a batch of control and mdx fibres obtained from mice older than approximately 35 weeks, resting [Ca2+]i was significantly lower in mdx (16 +/- 4 nM, n = 11) than in control fibres (71 +/- 10 nM, n = 14). 3. Changes in [Ca2+]i elicited by short (5-35 ms) depolarizing pulses from -80 to 0 mV showed similar properties in control and mdx fibres. After a 5 ms duration pulse the mean time constant of [Ca2+]i decay was, however, significantly elevated in mdx as compared to control fibres, by a factor of 1.5-2. For longer pulses, no significant difference could be detected. 4. In response to 50 ms duration depolarizing pulses of various amplitudes the threshold for detection of an [Ca2+]i change and the peak [Ca2+]i reached for a given potential were similar in control and mdx fibres. 5. Overall results show that mdx skeletal muscle fibres are quite capable of handling [Ca2+]i at rest and in response to membrane depolarizations.


Figures

Figure 1
Figure 1. Changes in membrane potential recorded in response to voltage-clamp depolarizations
The noisy traces correspond to the changes in membrane potential, recorded with a single microelectrode, in response to 20 ms voltage-clamp command steps (superimposed continuous lines) of 20, -20 and -40 mV applied to the skeletal muscle fibre with the patch-clamp amplifier. The inset shows the same records after scaling by the corresponding change in command voltage.
Figure 2
Figure 2. Initial resting [Ca2+]i in control and mdx muscle fibres
The top panels show the individual values of initial resting [Ca2+]i measured in 72 control (left) and 57 mdx fibres (right). [Ca2+]i values are plotted versus the age of the mice from which muscle fibres were isolated. The bottom panels show the corresponding mean and s.e.m. values of resting [Ca2+]i from mice of similar ages; these values were obtained from averaging data points over a period arbitrarily set to every consecutive 10 weeks. The number of fibres is indicated above each corresponding bar.
Figure 3
Figure 3. Indo-1 calcium transients elicited by short depolarizing pulses in a control and in an mdx fibre exhibiting a similar resting [Ca2+]i
A, indo-1 percentage saturation traces from a control (left) and an mdx fibre (right) in response to 5, 15 and 25 ms duration command pulses to 0 mV (Vc, bottom traces). The control and the mdx fibre were from a 13- and a 7-week-old mouse, respectively. B, [Ca2+]i transients calculated from the above corresponding indo-1 percentage saturation traces. For clarity, [Ca2+]i traces elicited by pulses of increasing duration are shifted in the x and y direction. The smooth curves superimposed on the decay of the [Ca2+]i traces correspond to the results from fitting a single exponential plus constant function. The value of the corresponding time constant is indicated next to each trace.
Figure 4
Figure 4. Average properties of indo-1 calcium transients elicited by short depolarizing pulses in a batch of control and mdx muscle fibres exhibiting similar resting [Ca2+]i levels
A, mean (continuous trace) ±s.e.m. (vertical lines) indo-1 percentage saturation traces elicited by 5 and 15 ms depolarizing pulses at 0 mV in 10 control (left) and 7 mdx fibres (right). B, from top to bottom, mean ±s.e.m. values of peak [Ca2+]i, time constant of [Ca2+]i decay and final [Ca2+]i level measured from the individual control and mdx[Ca2+]i traces on which exponential fits were performed. The number of fibres used for each pulse duration is indicated at the top of B.
Figure 5
Figure 5. Indo-1 calcium transients elicited by 50 ms depolarizing pulses of increasing amplitude in a control and in an mdx fibre exhibiting a similar resting [Ca2+]i
A, indo-1 percentage saturation traces from a control (left) and an mdx fibre (right) in response to depolarizing command steps at -40, -30, -20, -10, 0 and +10 mV (Vc, bottom traces). The control and the mdx fibre were from a 13- and an 11-week-old mouse, respectively. B, [Ca2+]i transients calculated from the above corresponding indo-1 percentage saturation traces; traces are displayed for pulses of increasing amplitude from left to right. C, mean ±s.e.m. indo-1 peak percentage saturation measured in response to 50 ms depolarizations at various command potentials. •, control fibres (n= 14); ^, mdx fibres (n= 6).
Figure 6
Figure 6. Indo-1 calcium transients elicited by depolarizing pulses at 0 mV of increasing duration in a control and in an mdx fibre from a batch of mice older than ≈35 weeks
The mdx fibres from this batch displayed a significantly lower mean resting [Ca2+]i than control ones. A, a series of indo-1 percentage saturation traces from a control (left) and an mdx fibre (right) in response to 5, 15 and 45 ms duration command pulses at 0 mV. The control and mdx fibre were from a 50- and a 41-week-old mouse, respectively. B, [Ca2+]i transients calculated from the above corresponding indo-1 percentage saturation traces. The smooth curves superimposed on the decay of the [Ca2+]i traces correspond to the results from fitting a single exponential plus constant function. The value of the corresponding time constant is indicated next to each trace.
Figure 7
Figure 7. Average properties of indo-1 calcium transients elicited by depolarizing pulses of increasing duration in fibres from a batch of control and mdx mice older than ≈35 weeks
A, mean (continuous trace) ±s.e.m. (vertical lines) indo-1 percentage saturation traces elicited by 5, 15, 25, 35 and 45 ms depolarizing pulses at 0 mV in 13 control (left) and 11 mdx fibres (right). B, from top to bottom, mean ±s.e.m. values of peak [Ca2+]i, time constant of [Ca2+]i decay and final [Ca2+]i level, measured from the individual control and mdx[Ca2+]i traces on which exponential fits were performed. The number of fibres used for each pulse duration is indicated next to the peak [Ca2+]i data points in B.
Figure 8
Figure 8. Indo-1 calcium transients elicited by 50 ms depolarizing pulses of increasing amplitude in control and in mdx fibres from a batch of mice older than ≈35 weeks
A, indo-1 percentage saturation traces from a control (left) and an mdx fibre (right) in response to depolarizing command steps at -40, -30, -20, -10, 0 and +10 mV. The control and mdx fibre were from a 50- and a 38-week-old mouse, respectively. B, mean ±s.e.m. indo-1 peak percentage saturation measured in response to 50 ms depolarizations at various command potentials (Vc). •, control fibres (n= 11); ^, mdx fibres (n= 11).

References

    1. Anderson JE, Bressler BH, Ovalle WK. Functional regeneration in the hindlimb skeletal muscle of the mdx mouse. Journal of Muscle Research and Cell Motility. 1988;9:499–515. - PubMed
    1. Bakker AJ, Head SI, Williams DA, Stephenson DG. Ca2+ levels in myotubes grown from the skeletal muscle of dystrophic (mdx) and normal mice. The Journal of Physiology. 1993;460:1–13. - PMC - PubMed
    1. Berthier C, Amsellem J, Blaineau S. Visualization of the subsarcolemmal cytoskeleton network of mouse skeletal muscle cells by en face views and application to immunoelectron localization of dystrophin. Journal of Muscle Research and Cell Motility. 1995;16:553–566. - PubMed
    1. Bulfield G, Siller WG, Wight PA, Moore KJ. X chromosome-linked muscular dystrophy (mdx) in the mouse. Proceedings of the National Academy of Sciences of the USA. 1984;81:1189–1192. - PMC - PubMed
    1. Carnwath JW, Shotton DM. Muscular dystrophy in the mdx mouse: histopathology of the soleus and extensor digitorum longus muscles. Journal of the Neurological Sciences. 1987;80:39–54. - PubMed

Publication types

LinkOut - more resources