. 1999 Oct 15;520 Pt 2(Pt 2):473-83.
doi: 10.1111/j.1469-7793.1999.00473.x.

Effects of calcium buffering on glucose-induced insulin release in mouse pancreatic islets: an approximation to the calcium sensor

Affiliations

Effects of calcium buffering on glucose-induced insulin release in mouse pancreatic islets: an approximation to the calcium sensor

J A Pertusa et al. J Physiol. .

Abstract

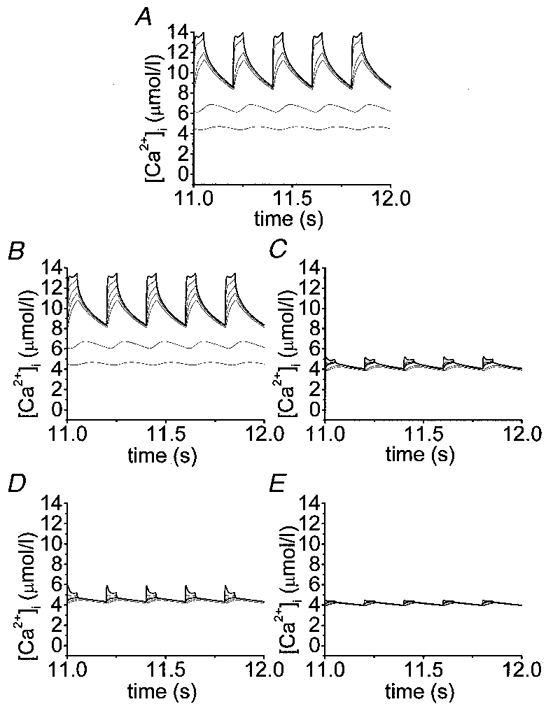
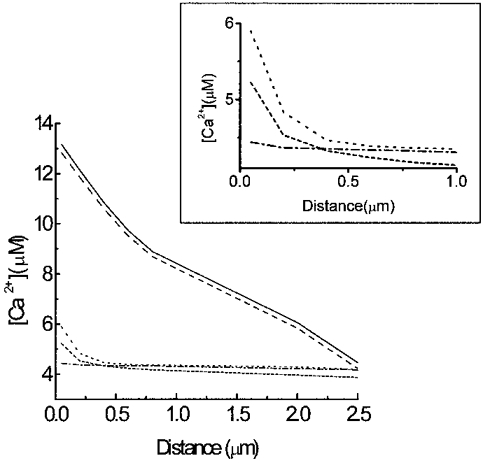
1. The properties of the calcium sensor for glucose-induced insulin secretion have been studied using cell-permeant Ca2+ buffers with distinct kinetics and affinities. In addition, submembrane cytosolic Ca2+ distribution has been modelled after trains of glucose-induced action potential-like depolarizations. 2. Slow Ca2+ buffers (around 1 mmol l-1 intracellular concentration) with different affinities (EGTA and Calcium Orange-5N) did not significantly affect glucose-induced insulin release. Modelling showed no effect on cytosolic Ca2+ concentrations at the outermost shell (0.05 microm), their effects being observed in the innermost shells dependent on Ca2+ affinity. 3. In contrast, fast Ca2+ buffers (around 1 mmol l-1 intracellular concentration) with different affinities (BAPTA and Calcium Green-5N) caused a 50 % inhibition of early insulin response and completely blocked the late phase of glucose-induced insulin response, their simulations showing a decrease of [Ca2+]i at both the inner and outermost shells. 4. These data are consistent with the existence in pancreatic beta-cells of a higher affinity Ca2+ sensor than that proposed for neurons. Moreover, these data are consistent with the proposed existence of two distinct pools of granules: (i) 'primed' vesicles, colocalized with Ca2+ channels and responsible of the first phase of insulin release; and (ii) 'reserved pool' vesicles, not colocalized and responsible for the second phase.


Figures

Figure 1
Figure 1. Effects of different exogenous Ca2+ chelators on glucose-induced electrical activity
Islets were loaded for 1 h at 37 °C in modified Krebs buffer with 100 μmol l−1 of the different exogenous chelators in AM form. The records show representative examples of the effects of 11.1 mmol l−1 glucose on intracellularly recorded membrane potential of a pancreatic β-cell in an intact islet perifused with Krebs buffer. A, unloaded control islet. B, 100 μmol l−1 EGTA-loaded islet. C, 100 μmol l−1 BAPTA-loaded islet. Results are representative of 4 out of 4 cells.
Figure 2
Figure 2. Effects of different exogenous Ca2+ chelators on islet glucose-induced insulin release
Islets were loaded for 1 h at 37 °C in modified Krebs buffer with 100 μmol l−1 of the different exogenous chelators in AM form. Then, batches of 10 islets were perifused at a flow rate of 1 ml min−1 at 37 °C with fresh modified Krebs buffer supplemented with 1 % bovine serum albumin. After a 30 min stabilization period with 3 mmol l−1 glucose, the islets were perifused for 10 min with 3 mmol l−1 glucose, then for 20 min with 22.2 mmol l−1 glucose and finally for 10 min with 3 mmol l−1 glucose. A, unloaded control islets. B, 100 μmol l−1 EGTA-loaded islets. C, 100 μmol l−1 BAPTA-loaded islets. D, 100 μmol l−1 Calcium Orange-5N-loaded islets. E, 100 μmol l−1 Calcium Green-5N-loaded islets. Insulin was assayed by radioimmunoassay and determinations were run in triplicate (IRI, immunoreactive insulin). Values are expressed as means ±s.e.m. of 7 experiments. Bars represent the addition of the different glucose concentrations.
Figure 3
Figure 3. Effects of different exogenous Ca2+ chelators on isolated islet cell glucose-induced insulin release
Islet cells were loaded for 1 h at 37 °C in modified Krebs buffer with 100 μmol l−1 of the different exogenous chelators in AM form. Then, 1 × 10⁵ islet cells were perifused at a flow rate of 1 ml min−1 at 37 °C with fresh modified Krebs buffer supplemented with 1 % bovine serum albumin. After a 30 min stabilization period with 3 mmol l−1 glucose, the islet cells were perifused for 10 min with 3 mmol l−1 glucose, then for 20 min with 22.2 mmol l−1 glucose and finally for 10 min with 3 mmol l−1 glucose. A, unloaded control islet cells. B, 100 μmol l−1 EGTA-loaded islet cells. C, 100 μmol l−1 BAPTA-loaded islet cells. Insulin was assayed by radioimmunoassay and determinations were run in triplicate. Values are expressed as means ±s.e.m. of 4 experiments. Bars represent the addition of the different glucose concentrations.
Figure 4
Figure 4. Effects of exogenous Ca2+ chelators with similar affinity and different forward binding constant on [Ca2+]i
Simulation of time courses of cytosolic Ca2+ transients for a train of 60 potential-like depolarizations (50 ms each separated by 150 ms). Different profiles in each panel correspond to Ca2+ transients at shells positioned 0.05 (outermost), 2.0 and 2.5 μm underneath the membrane. Other parameters are as in Table 1. In addition to the endogenous fixed buffers (A), the effects of 853 μmol l−1 EGTA (B), 927 μmol l−1 BAPTA (C), 1280 μmol l−1 Calcium Orange-5N (D) and 1416 μmol l−1 Calcium Green-5N (E) have been simulated as indicated.
Figure 5
Figure 5. Detailed effects of exogenous Ca2+ chelators with similar affinity and different forward binding constant on [Ca2+]i
Simulation of time courses of cytosolic Ca2+ transients after reaching the steady state (last 5 pulses of a train of 60 potential-like depolarizations; 50 ms each separated by 150 ms). Different profiles in each panel correspond to Ca2+ transients at shells positioned 0.05 (outermost, represented as bold trace), 0.2, 0.4, 0.6, 0.8, 2.0 and 2.5 μm beneath the membrane. Other parameters are as in Table 1. In addition to the endogenous fixed buffers (A), the effects of 853 μmol l−1 EGTA (B), 927 μmol l−1 BAPTA (C), 1280 μmol l−1 Calcium Orange-5N (D) and 1416 μmol l−1 Calcium Green-5N (E) have been simulated as indicated.
Figure 6
Figure 6. Computer simulation of the effects of exogenous Ca2+ chelators on [Ca2+]i gradients within a β-cell at various distances from the plasma membrane
Simulation of cytosolic Ca2+ gradients built during the last Ca2+ transient after a train of 60 potential-like depolarizations. In addition to the endogenous fixed buffer (continuous line), the effects of 853 μmol l−1 EGTA (dashed line), 927 μmol l−1 BAPTA (short-dashed line), 1280 μmol l−1 Calcium Orange-5N (dotted line) and 1416 μmol l−1 Calcium Green-5N (dashed-dotted line) on submembrane [Ca2+]i gradient have been simulated as indicated. Inset, detailed [Ca2+]i gradients in the first micrometre from the plasma membrane.

References

    1. Adler EM, Augustine GJ, Duffy SN, Charlton MP. Exogenous intracellular calcium chelators attenuate neurotransmitter release at the squid giant synapse. Journal of Neuroscience. 1991;11:1496–1507. - PMC - PubMed
    1. Ashcroft FM, Harrison DE, Ashcroft SJH. Glucose induces closure of single potassium channels in isolated rat pancreatic β-cells. Nature. 1984;312:446–448. - PubMed
    1. Ashcroft FM, Rorsman P. Electrophysiology of the pancreatic β-cell. Progress in Biophysics and Molecular Biology. 1989;54:87–143. - PubMed
    1. Atwater I, Ribalet B, Rojas E. Cyclic changes in potential resistance of the β-cell membrane induced by glucose in islets of Langerhans from mouse. The Journal of Physiology. 1978;278:117–139. - PMC - PubMed
    1. Bokvist K, Eliasson L, Ämmälä C, Renström E, Rorsman P. Colocalization of L-type Ca2+ channels and insulin-containing secretory granules and its significance for the initiation of exocytosis in mouse pancreatic β-cell. EMBO Journal. 1995;14:50–57. - PMC - PubMed

Publication types

LinkOut - more resources