. 1999 Oct;9(10):978-88.
doi: 10.1101/gr.9.10.978.

A comprehensive view of human chromosome 1

Affiliations

A comprehensive view of human chromosome 1

P S White et al. Genome Res. 1999 Oct.

Abstract

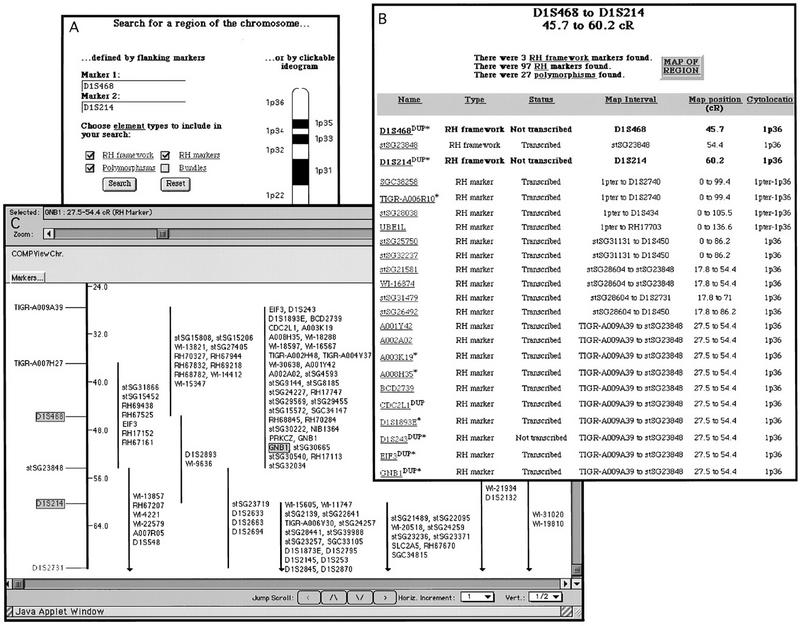
Comprehensive representations of human chromosomes combining diverse genomic data sets, localizing expressed sequences, and reflecting physical distance are essential for disease gene identification and sequencing efforts. We have developed a method (CompView) for integrating genomic information derived from available cytogenetic, genetic linkage, radiation hybrid, physical, and transcript-based mapping approaches. CompView generates chromosome representations with substantially higher resolution, coverage, and integration than current maps of the human genome. The CompView process was used to build a representation of human chromosome 1, yielding a map with >13,000 unique elements, an effective resolution of 910 kb, and a marker density of 50 kb. CompView creates comprehensive and fully integrated depictions of a chromosome's clinical, biological, and structural information.


Figures

Figure 1
Figure 1
Chromosome 1 RH framework. Framework markers are listed horizontally from top left to bottom right starting at the 1p terminus. Markers are spaced proportionally to their centiRay positions. Cytolocations are indicated at the beginning of each line. An approximate physical scale is represented at bottom right.
Figure 2
Figure 2
Venn diagram of marker subtypes. The diagram shows the distribution of markers between and among the RH, GL, and physical tiers. The RH and GL marker sets are defined by all RH and GL markers assigned map positions in CompView (n = 4220 and n = 788), respectively. The physical marker set is defined by the number of unique markers with associated WICGR YACs and/or Sanger PAC/BACs (n = 2480), a subset of which (n = 1742) is localized in CompView.
Figure 3
Figure 3
CompView Web interface examples. (A) Input screen to search for a region of the chromosome. Regions can be defined by two flanking markers (left), by clicking on a cytogenetic band from a chromosome ideogram (right), or by selecting one or a range of cytogenetic bands (not shown). A query input for the region between D1S468 and D1S214 is displayed. (B) Tabular return for the query D1S468 to D1S214 from A. The marker type, transcriptional status, RH interval, RH map position, and cytolocation are shown for each marker, with a hyperlink to more complete information provided for each marker. At top is shown the total number of each type of marker found. Clicking on the “map of region” button at top right yields C. (C) Graphical return of the query D1S468 to D1S214 viewed with Mapview. In this example, only the RH framework (left) and a portion of the RH markers' tier (right) are visible. CentiRay distances from 1pter are shown at right of the framework. Intervaled RH markers are preceded with a vertical line indicating their 1000:1 likelihood positions relative to the RH framework. The markers used for querying are highlighted on the framework, as is the RH marker for GNB1; clicking on GNB1 yields the marker record shown in Fig. 4.
Figure 4
Figure 4
Marker record example. Shown is the individual record for gene GNB1. Underlined text indicates a hypertext link. External database links are present in this example to dbEST (see Table 2 legend for abbreviations), GDB, Sanger, GenBank, UniGene, and RHdb entries for this marker; to perform a BLAST search of the nonredundant (GenBank), EST (EST), and high-throughput genomic sequence (HTGS) collections in GenBank; to search GeneCards, OMIM, and BioHunt for “GNB1”; and to search the Sanger Centre chromosome 1 mapping database Acedb1 for BACs and PACs with the GNB1 primer sequences. The buttons labeled “MAP OF GNB1” and “GNB1 REGION” provide a graphical depiction of the region surrounding GNB1 analogous to Fig. 3C and a tabular summary of all markers mapping to this region analogous to Fig. 3B, respectively. The data category names listed at left (such as “Expression status”) are hyperlinked to help pages describing the category.

References

    1. Benham F, Hart K, Crolla J, Bobrow M, Francavilla M, Goodfellow PN. A method for generating hybrids containing nonselected fragments of human chromosomes. Genomics. 1989;4:509–517. - PubMed
    1. Bernardi G. The isochore organization of the human genome. Annu Rev Genet. 1989;23:637–661. - PubMed
    1. Boguski MS, Schuler GD. ESTablishing a human transcript map. Nat Genet. 1995;10:369–371. - PubMed
    1. Brown DM, Matise TC, Koike G, Simon JS, Winer ES, Zangen S, McLaughlin MG, Shiozawa M, Atkinson OS, Hudson JRJ, et al. An integrated genetic linkage map of the laboratory rat. Mamm Genome. 1998;9:521–530. - PubMed
    1. Chee M, Yang R, Hubbell E, Berno A, Huang XC, Stern D, Winkler J, Lockhart DJ, Morris MS, Fodor SPA. Accessing genetic information with high-density arrays. Science. 1996;274:610–614. - PubMed

Publication types

LinkOut - more resources