Comparative Study
. 1999 Nov;37(11):3601-7.
doi: 10.1128/JCM.37.11.3601-3607.1999.

Monitoring treatment of patients with pulmonary tuberculosis: can PCR be applied?

Affiliations
Comparative Study

Monitoring treatment of patients with pulmonary tuberculosis: can PCR be applied?

V O Thomsen et al. J Clin Microbiol. 1999 Nov.

Abstract

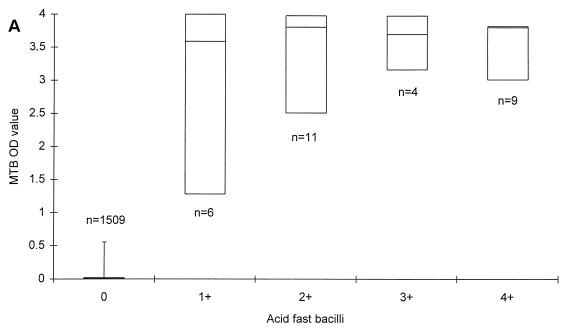
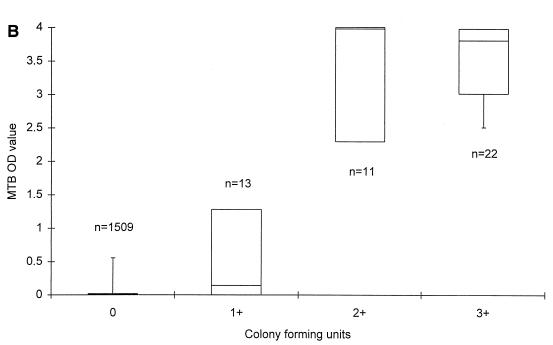
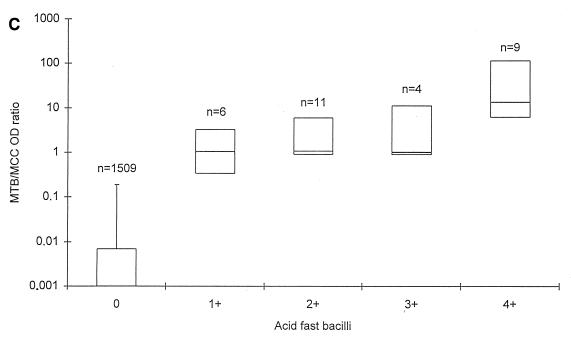
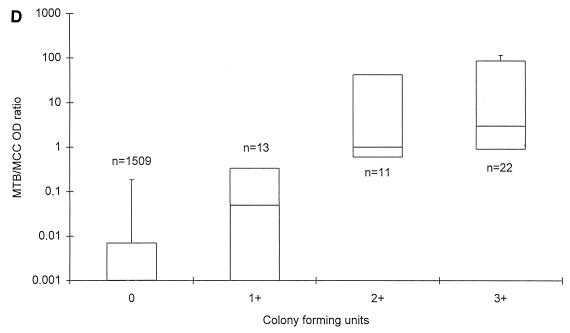
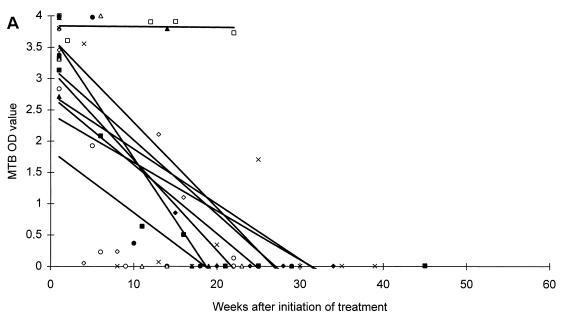
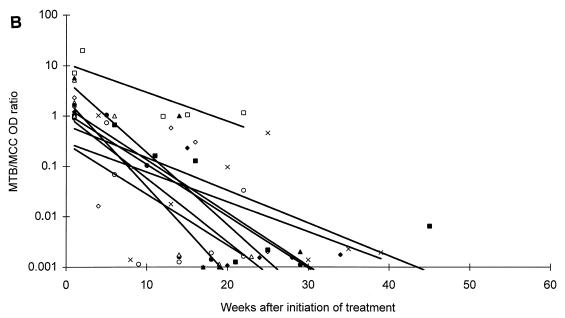
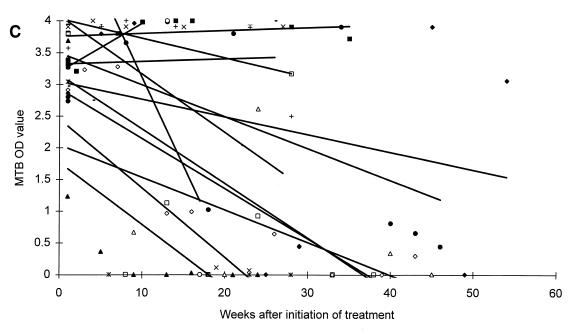
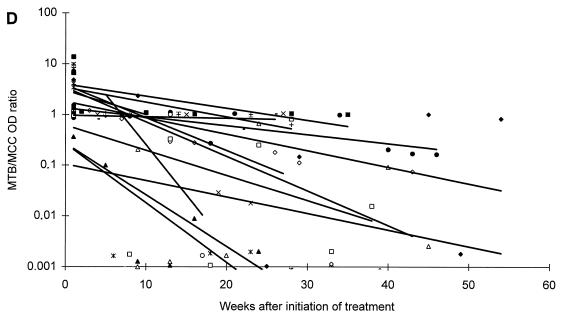
To assess whether PCR is applicable for monitoring the efficacy of antituberculous treatment, respiratory specimens obtained during treatment and follow-up from sputum smear-positive tuberculosis (TB) patients were examined. First, results of smear, culture, and PCR for Mycobacterium tuberculosis complex (MTB) and an internal inhibition control (MCC) were correlated retrospectively on 1,601 respiratory specimens from patients with no previous cultures of MTB. MTB optical density (OD) values increased to a maximum level of 3.5 to 4.0, with both increasing numbers of acid-fast bacilli and CFU. MTB/MCC OD ratios also increased with both smear and culture grading and correlated significantly better with both than the MTB OD value. Second, changes in MTB OD values and MTB/MCC OD ratios were compared with microscopy and culture for MTB in monthly sputa obtained during treatment and follow-up in 22 smear-positive pulmonary TB patients. Declines in MTB/MCC OD ratios during antituberculous treatment and follow-up were observed. Patients with moderate disease reached the baseline after 6 to 8 months of standard antituberculous treatment regimen, whereas patients with extensive disease were predicted to reach the baseline 1 year or more after the initiation of treatment. Although PCR detects both dead and live bacteria, we believe that PCR can be used to assess the efficacy of antituberculous treatment since increases or slow reductions in MTB/MCC OD ratios would indicate nonoptimal treatment, noncompliance, reduced bioavailability of drugs, or resistant strains of MTB and thereby would identify patients at risk for treatment failure or reactivation.


Figures

FIG. 1
FIG. 1
MTB OD values (A and B) and MTB/MCC OD ratios (C and D) in relation to microscopy (A and C) and MTB culture grading (B and D) on respiratory specimens from patients with no documentation of previous culture-proven TB. The lines within the boxes represent the median values, and the bars represent the 5th and 95th percentiles.
FIG. 1
FIG. 1
MTB OD values (A and B) and MTB/MCC OD ratios (C and D) in relation to microscopy (A and C) and MTB culture grading (B and D) on respiratory specimens from patients with no documentation of previous culture-proven TB. The lines within the boxes represent the median values, and the bars represent the 5th and 95th percentiles.
FIG. 2
FIG. 2
Changes in MTB OD values (A and C) and MTB/MCC OD ratios (B and D) during antituberculous treatment and follow-up of patients with moderate (A and B) or extensive (C and D) disease. Regression lines for individual patients are inserted.
FIG. 2
FIG. 2
Changes in MTB OD values (A and C) and MTB/MCC OD ratios (B and D) during antituberculous treatment and follow-up of patients with moderate (A and B) or extensive (C and D) disease. Regression lines for individual patients are inserted.
FIG. 2
FIG. 2
Changes in MTB OD values (A and C) and MTB/MCC OD ratios (B and D) during antituberculous treatment and follow-up of patients with moderate (A and B) or extensive (C and D) disease. Regression lines for individual patients are inserted.
FIG. 2
FIG. 2
Changes in MTB OD values (A and C) and MTB/MCC OD ratios (B and D) during antituberculous treatment and follow-up of patients with moderate (A and B) or extensive (C and D) disease. Regression lines for individual patients are inserted.

References

    1. Afghani B, Lieberman J M, Duke M B, Stutman H R. Comparison of quantitative polymerase chain reaction, acid-fast bacilli smear, and culture results in patients receiving therapy for pulmonary tuberculosis. Diagn Microbiol Infect Dis. 1998;29:73–79. - PubMed
    1. Albert R K, Iseman M D, Sbarbaro J A, Stage A, Pierson D J. Monitoring patients with tuberculosis for failure during and after treatment. Am Rev Respir Dis. 1976;114:1051–1060. - PubMed
    1. Bennedsen J, Thomsen V Ø, Pfyffer G E, Funke G, Feldmann K, Beneke A, Jenkins P A, Hegginbothom M, Fahr A, Hengstler M, Cleator G, Klapper P, Wilkins E G L. Utility of PCR in diagnosing pulmonary tuberculosis. J Clin Microbiol. 1996;34:1407–1411. - PMC - PubMed
    1. Chan S L. Chemotherapy of tuberculosis. In: Davies P D O, editor. Clinical tuberculosis. London, England: Chapman & Hall Medical; 1994. pp. 141–56.
    1. Clarridge J E, III, Shawar R M, Shinnick T M, Plikaytis B B. Large-scale use of polymerase chain reaction for detection of Mycobacterium tuberculosis in a routine mycobacteriology laboratory. J Clin Microbiol. 1993;31:2049–2056. - PMC - PubMed

Publication types

MeSH terms

Substances

LinkOut - more resources