. 1999 Oct 18;190(8):1039-48.
doi: 10.1084/jem.190.8.1039.

Pre-T cell receptor (TCR) and TCR-controlled checkpoints in T cell differentiation are set by Ikaros

Affiliations

Pre-T cell receptor (TCR) and TCR-controlled checkpoints in T cell differentiation are set by Ikaros

S Winandy et al. J Exp Med. .

Abstract

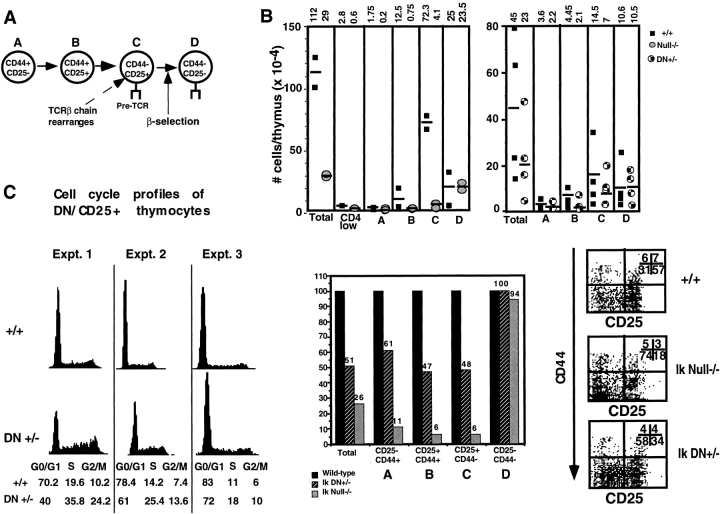
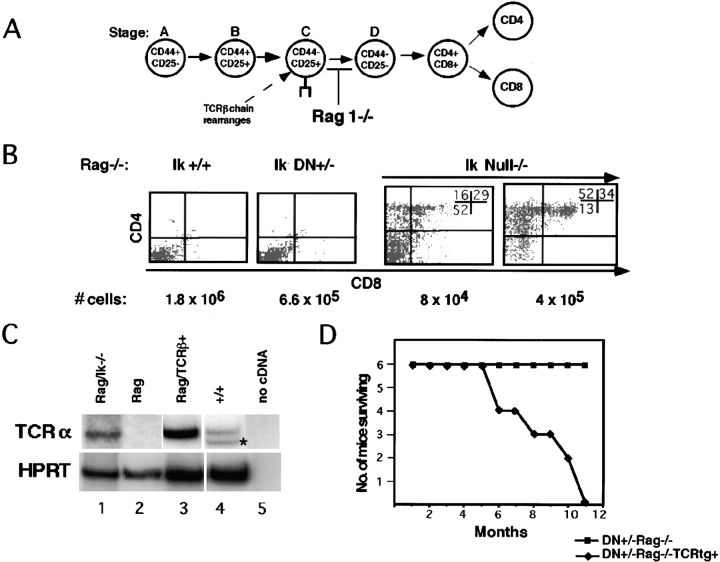
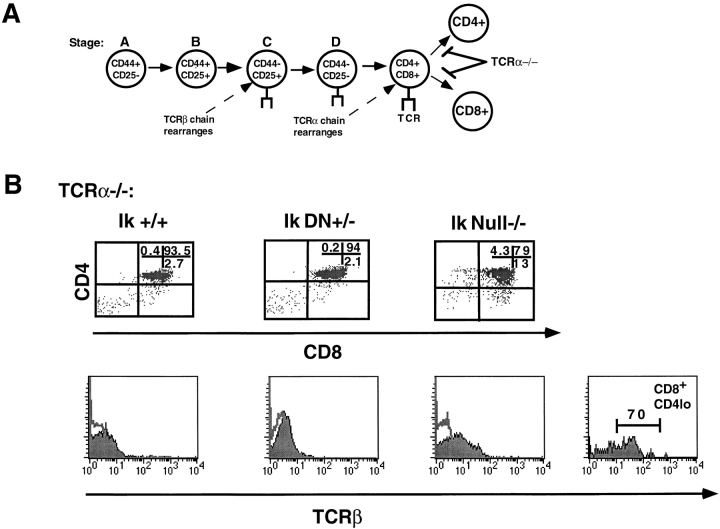
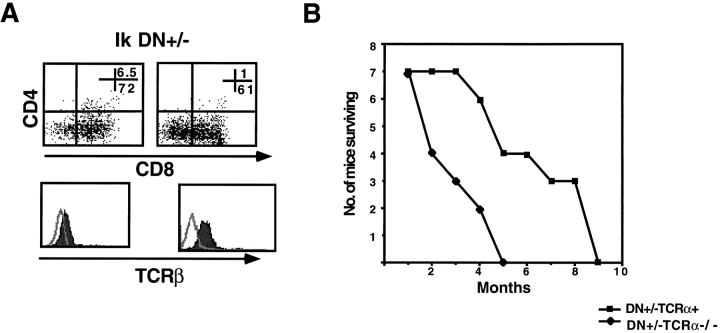
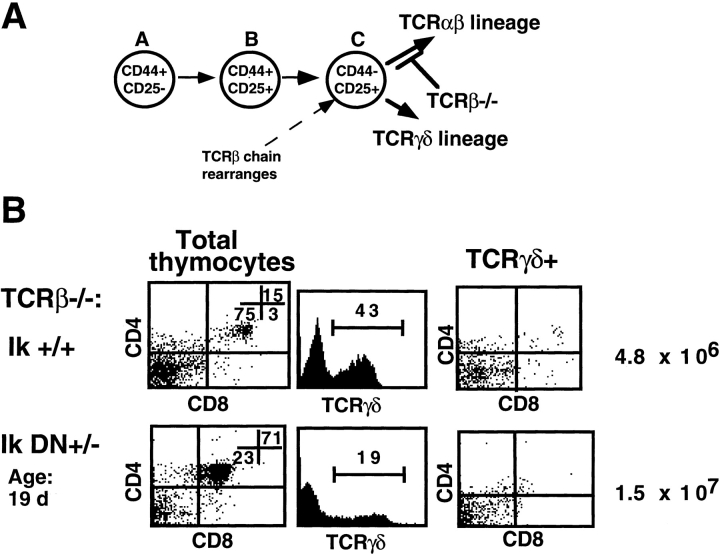
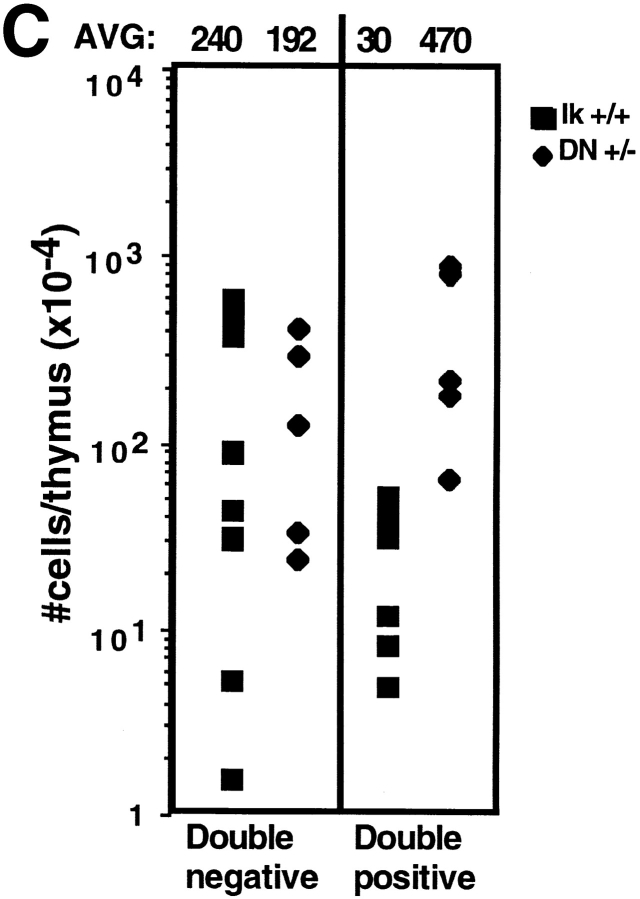
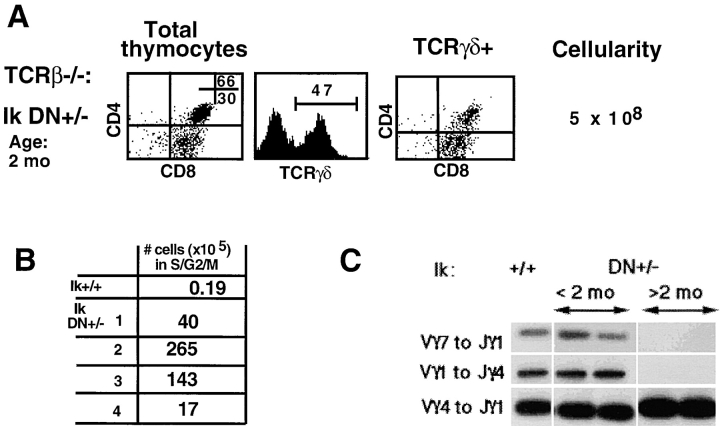
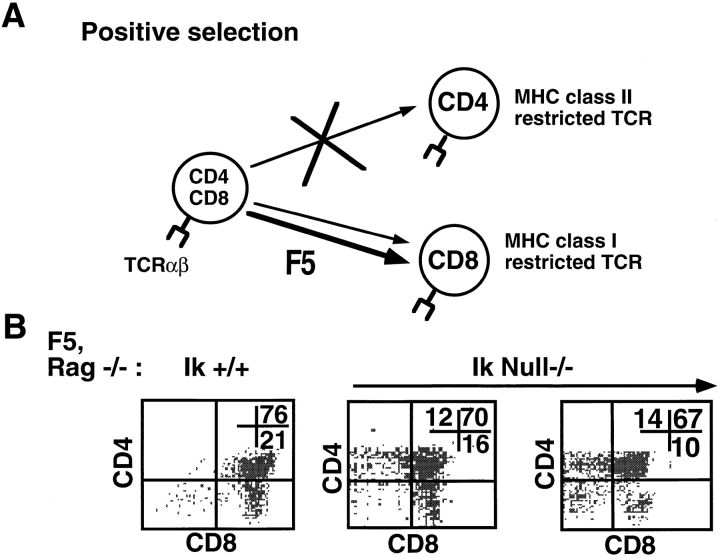
T cell differentiation relies on pre-T cell receptor (TCR) and TCR signaling events that take place at successive steps of the pathway. Here, we show that two of these T cell differentiation checkpoints are regulated by Ikaros. In the absence of Ikaros, double negative thymocytes can differentiate to the double positive stage without expression of a pre-TCR complex. Subsequent events in T cell development mediated by TCR involving transition from the double positive to the single positive stage are also regulated by Ikaros. Nonetheless, in Ikaros-deficient thymocytes, the requirement of pre-TCR expression for expansion of immature thymocytes as they progress to the double positive stage is still maintained, and the T cell malignancies that invariably arise in the thymus of Ikaros-deficient mice are dependent on either pre-TCR or TCR signaling. We conclude that Ikaros regulates T cell differentiation, selection, and homeostasis by providing signaling thresholds for pre-TCR and TCR.


Figures

Figure 1
Figure 1
Differentiation profiles of early T cell precursors in the absence of Ikaros. (A) Schematic of differentiation events within the double negative T cell precursor stage in the thymus. (B) Numbers and staining profiles of double negative T cell precursor subsets in Ikaros wild-type, DN+/−, and null−/− thymi. Data from six independent experiments are shown: two comparing wild-type (+/+) and Ikaros null−/− double negative populations, and four comparing wild-type and Ikaros DN+/− double negative populations. Horizontal lines indicate the average absolute number of precursors that fall into each subset, also illustrated in the bar graph (y-axis is the ratio of double negative cells that fall into each subset compared with wild-type, which is considered as 100%). Numbers shown in representative FACS® profiles denote the relative percentage of cells that fall into each quadrant. Ik, Ikaros. (C) Histograms showing cell cycle profiles of double negative (DN) thymocytes. DN thymocytes were stained with anti-CD25–FITC, ethanol fixed, then stained with propidium iodide/RNase. Propidium iodide staining profiles (DNA content) of CD25+ cells from each genotype for three representative experiments are shown. The percentage of cells containing DNA contents placing them in G0/G1, S, or G2/M are shown below. Expt., experiment.
Figure 2
Figure 2
Thymocyte development proceeds in the absence of pre-TCR signaling in the absence of Ikaros. (A) Schematic depicting block in differentiation that occurs in RAG-1 −/− thymocytes. (B) Representative FACS® profiles showing staining patterns of thymocytes in RAG −/− mice with the following Ikaros (Ik) genotypes: +/+, DN+/−, and null−/−. Thymocytes were stained with anti-CD4–PE and anti-CD8α–FITC. Numbers shown in FACS® profiles denote percentage of cells that fall into each quadrant. Cellularity of the thymus is shown below the profiles. (C) RT-PCR analysis to analyze expression of TCR-α germline transcripts in thymi of the following animals: Ikaros null−/− × RAG −/− (lane 1), Ikaros +/+ × RAG −/− (lane 2), Ikaros +/+, TCR β chain transgenic × RAG −/− (lane 3), wild-type (lane 4), and no cDNA control (lane 5). As expected, lane 2 shows the absence of germline transcripts in the absence of pre-TCR expression and development to the double positive stage, whereas lanes 3 and 4 show the normal expression of these transcripts when pre-TCR expression allows development to the double positive stage. Lane 1 shows that in the absence of Ikaros, thymocytes can express TCR-α germline transcripts in the absence of pre-TCR expression. The lower band present in lane 4 (denoted by an asterisk) represents message from rearranged TCR α chain genes. (D) Graph depicting morbidity due to lymphomagenesis in a cohort of six Ikaros DN+/− × RAG −/− mice vs. six Ikaros DN+/−, TCR transgene+ × RAG −/− mice. tg, transgene.
Figure 3
Figure 3
Developmental progression from double positive stage is deregulated in the absence of Ikaros. (A) Schematic depicting block in differentiation that occurs in TCR-α 2/− thymocytes. (B) Representative FACS® profiles showing staining patterns of thymocytes in young TCR-α 2/− mice with the following Ikaros (Ik) genotypes: +/+, null−/−, and DN+/−. Thymocytes were stained with anti-CD4–PE and anti-CD8α–FITC. Numbers shown in FACS® profiles denote percentage of cells that fall into each quadrant. Histogram profiles depict staining with anti–TCR β chain (solid histograms) and an isotype control antibody (outlined histograms). Two TCR β chain staining histograms are shown for the Ikaros null−/− × TCR-α 2/− thymocytes: one depicting the staining profile of total thymocytes (far left) and the other, the staining profile of the CD8+CD4lo thymocytes exclusively (far right). The expression of TCR β chain on the surface of these CD8+ thymocytes that do not express high levels of CD4 confirms that they are not immature single positives (ISPs).
Figure 4
Figure 4
Homeostasis of double positive thymocytes is deregulated in the absence of Ikaros. (A) Representative FACS® profiles showing staining patterns of thymocytes in two older Ikaros DN+/− × TCR-α 2/− mice with lymphomas. Thymocytes were stained with anti-CD4–PE and anti-CD8α–FITC. Numbers shown in FACS® profiles denote percentage of cells that fall into each quadrant. Histogram profiles depict staining with anti–TCR β chain (solid histograms) and an isotype control antibody (outlined histograms). (B) Graph denoting increased kinetics of morbidity due to lymphomagenesis in a cohort of seven Ikaros DN+/− × TCR-α 2/− mice compared with seven of their Ikaros DN+/− × TCR-α 1 counterparts.
Figure 5
Figure 5
Deregulated development of the TCR-γ/δ lineage in the absence of Ikaros. (A) Schematic depicting block in differentiation which occurs in TCR-β 2/− thymocytes. (B) Representative FACS® profiles showing staining patterns of thymocytes in young TCR-β 2/− mice with the following Ikaros (Ik) genotypes: +/+ and DN+/−. Thymocytes were stained with anti-CD4–PE, anti-CD8α–Cychrome, and anti–TCR-γδ–FITC. Numbers shown in FACS® profiles denote percentage of cells that fall into each quadrant. “Total thymocytes” shows profiles of total thymocyte populations, whereas “TCRγδ+” only shows profiles of cells that stain positively for TCR-γ/δ. (C) Numbers of double positive and double negative cells per thymus in 3–6-wk-old Ikaros (Ik) wild-type and DN+/− mice on the TCR-β 2/− genetic background. Average number (AVG) of precursors (×10−4) that fall into each subset is shown at the top of the graph.
Figure 5
Figure 5
Deregulated development of the TCR-γ/δ lineage in the absence of Ikaros. (A) Schematic depicting block in differentiation which occurs in TCR-β 2/− thymocytes. (B) Representative FACS® profiles showing staining patterns of thymocytes in young TCR-β 2/− mice with the following Ikaros (Ik) genotypes: +/+ and DN+/−. Thymocytes were stained with anti-CD4–PE, anti-CD8α–Cychrome, and anti–TCR-γδ–FITC. Numbers shown in FACS® profiles denote percentage of cells that fall into each quadrant. “Total thymocytes” shows profiles of total thymocyte populations, whereas “TCRγδ+” only shows profiles of cells that stain positively for TCR-γ/δ. (C) Numbers of double positive and double negative cells per thymus in 3–6-wk-old Ikaros (Ik) wild-type and DN+/− mice on the TCR-β 2/− genetic background. Average number (AVG) of precursors (×10−4) that fall into each subset is shown at the top of the graph.
Figure 6
Figure 6
Ikaros is required for homeostasis of TCR-γ/δ lineage cells. (A) Representative FACS® profiles showing staining patterns of thymocytes in older Ikaros (Ik) DN+/− × TCR-β 2/− mice. Thymocytes were stained with anti-CD4–PE, anti-CD8α–Cychrome, and anti–TCR-γδ–FITC. Numbers shown in FACS® profiles denote percentage of cells that fall into each quadrant. “Total thymocytes” shows profiles of total thymocyte populations, whereas “TCRγδ+” only shows profiles of cells that stain positively for TCR-γ/δ. (B) Thymocytes were ethanol fixed and then stained with propidium iodide/RNase. Cell cycle profiles were analyzed by FACS® analysis. The table shows percentage of cells from each genotype that contained >2 N DNA content, indicating that they were in the S or G2/M phase of the cell cycle. (C) PCR analysis was performed with primers to amplify rearrangements at the TCR γ chain locus. These three rearrangements were chosen because they are predominant in the adult mouse thymus (reference 14). As shown, although all three rearrangements are readily seen in Ikaros wild-type and young DN+/− × TCR-β 2/− thymi, indicating a polyclonal TCR-γ/δ repertoire, only a single rearrangement, in these cases Vγ4 to Jγ1, is observed in the older DN+/− × TCR-β 2/− thymocyte populations, suggesting a monoclonal outgrowth.
Figure 7
Figure 7
Differentiation to the single positive stage occurs without positive selection signals in the absence of Ikaros. (A and B) Representative FACS® profiles showing staining patterns of wild-type (+/+) and Ikaros (Ik) null−/− thymocytes. Thymocytes were stained with anti-CD4–PE, anti-CD8α–Cychrome, and anti-CD69–FITC. Numbers shown in FACS® profiles denote percentage of cells that fall into each quadrant. Histograms show staining levels with anti-CD69–FITC. Numbers indicate percentage of CD69+ cells within the total, CD4 single positive, and CD8 single positive thymocyte populations as listed above the histograms.
Figure 8
Figure 8
Inappropriate differentiation to CD4 T cells in the presence of a class I–restricted TCR. (A) Schematic depicting positive selection in F5 TCR × RAG −/− transgenic mice. (B) Representative FACS® profiles showing staining patterns of wild-type and Ikaros (Ik) null−/− thymocytes on the F5, RAG −/− genetic background. Thymocytes were stained with anti-CD4–PE, anti-CD8α–Cychrome, and anti–TCR-β–FITC. Shown are staining profiles of cells that express high levels of TCR. Numbers shown in FACS® profiles denote percentage of cells that fall into each quadrant.

References

    1. Godfrey D.I., Kennedy J., Mombaerts P., Tonegawa S., Zlotnik A. Onset of TCR-β gene rearrangement and role of TCR-β expression during CD3−CD4−CD8− thymocyte differentiation. J. Immunol. 1994;152:4783–4792. - PubMed
    1. von Boehmer H. Positive selection of lymphocytes. Cell. 1994;76:219–228. - PubMed
    1. Mombaerts P., Iacomini J., Johnson R., Herrup K., Tonegawa S., Papaioannou V. RAG-1-deficient mice have no mature B and T lymphocytes. Cell. 1992;68:869–877. - PubMed
    1. Mombaerts P., Clarke A., Rudnicki M., Iacomini J., Itohara S., Lafaille J., Wang L., Ichikawa Y., Jaenisch R., Hooper M., Tonegawa S. Mutations in T-cell antigen receptor genes α and β block thymocyte development at different stages [published erratum at 360:491] Nature. 1992;360:225–231. - PubMed
    1. Nossal G. Negative selection of lymphocytes. Cell. 1994;76:229–239. - PubMed

Publication types