. 1999 Oct 18;190(8):1123-34.
doi: 10.1084/jem.190.8.1123.

In vivo-activated CD4 T cells upregulate CXC chemokine receptor 5 and reprogram their response to lymphoid chemokines

Affiliations

In vivo-activated CD4 T cells upregulate CXC chemokine receptor 5 and reprogram their response to lymphoid chemokines

K M Ansel et al. J Exp Med. .

Abstract

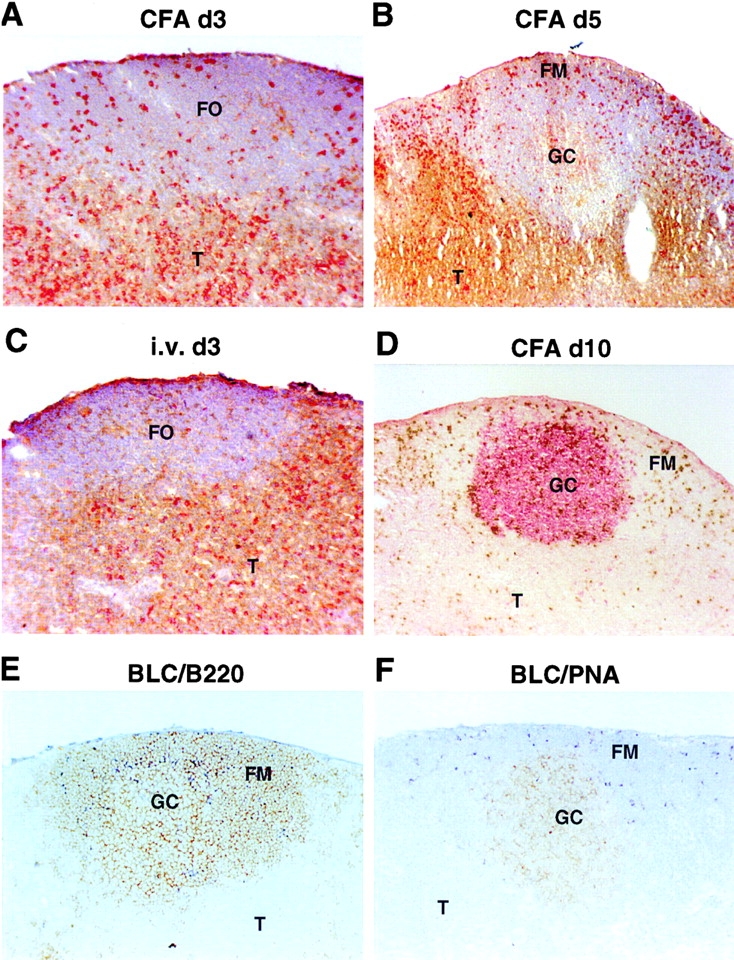
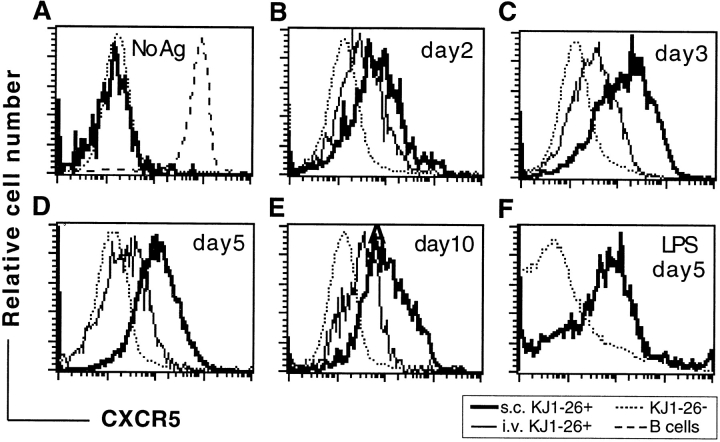
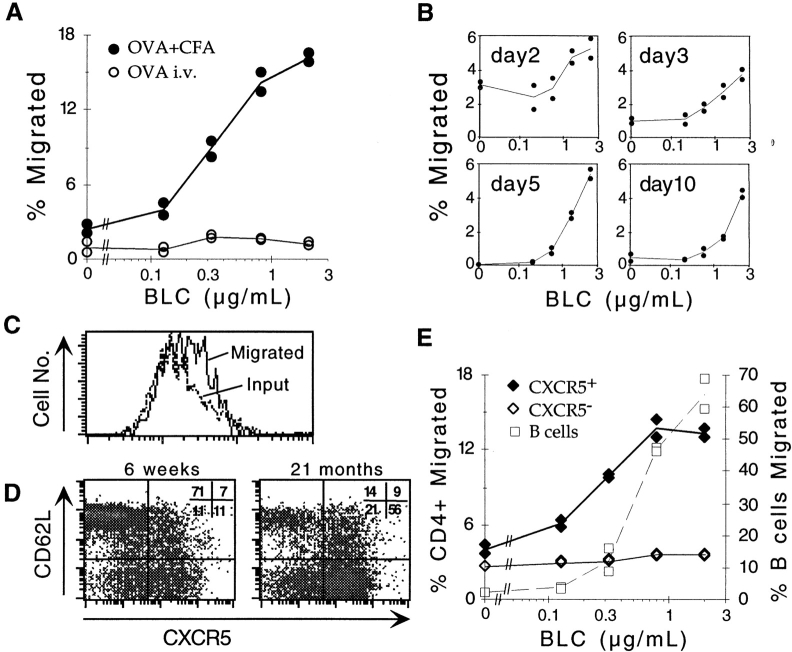
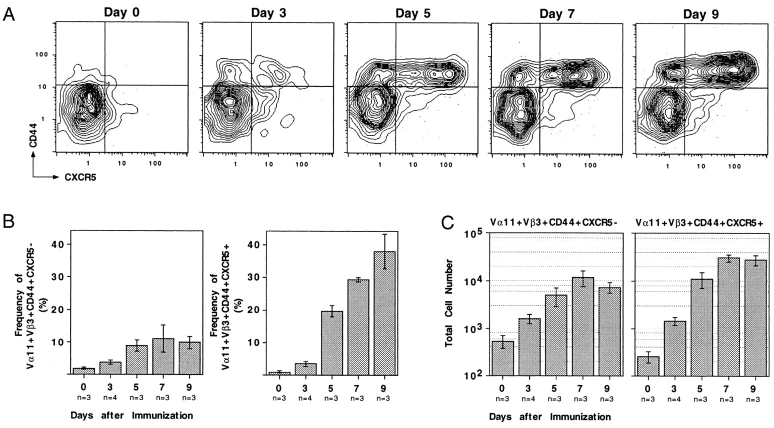
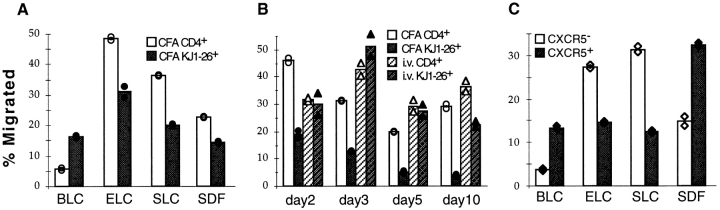
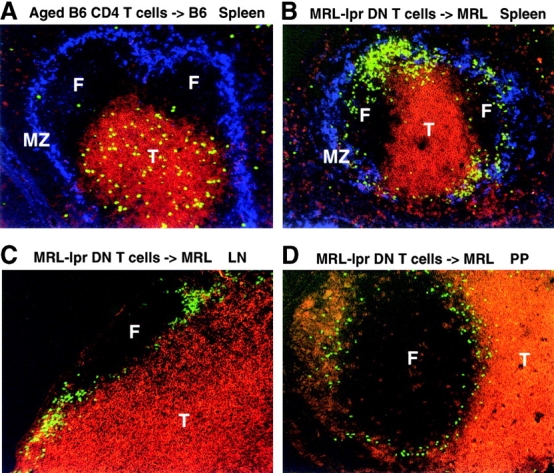
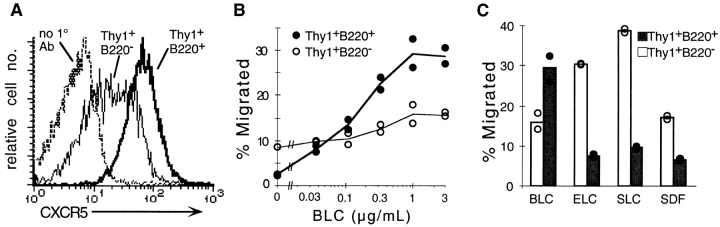
Migration of antigen-activated CD4 T cells to B cell areas of lymphoid tissues is important for mounting T cell-dependent antibody responses. Here we show that CXC chemokine receptor (CXCR)5, the receptor for B lymphocyte chemoattractant (BLC), is upregulated on antigen-specific CD4 T cells in vivo when animals are immunized under conditions that promote T cell migration to follicles. In situ hybridization of secondary follicles for BLC showed high expression in mantle zones and low expression in germinal centers. When tested directly ex vivo, CXCR5(hi) T cells exhibited a vigorous chemotactic response to BLC. At the same time, the CXCR5(hi) cells showed reduced responsiveness to the T zone chemokines, Epstein-Barr virus-induced molecule 1 (EBI-1) ligand chemokine (ELC) and secondary lymphoid tissue chemokine (SLC). After adoptive transfer, CXCR5(hi) CD4 T cells did not migrate to follicles, indicating that additional changes may occur after immunization that help direct T cells to follicles. To further explore whether T cells could acquire an intrinsic ability to migrate to follicles, CD4(-)CD8(-) double negative (DN) T cells from MRL-lpr mice were studied. These T cells normally accumulate within follicles of MRL-lpr mice. Upon transfer to wild-type recipients, DN T cells migrated to follicle proximal regions in all secondary lymphoid tissues. Taken together, our findings indicate that reprogramming of responsiveness to constitutively expressed lymphoid tissue chemokines plays an important role in T cell migration to the B cell compartment of lymphoid tissues.


Figures

Figure 2
Figure 2
Follicular homing of in vivo–activated OVA-specific T cells and expression pattern of BLC in secondary follicles. (A–C) Staining of LN sections to detect KJ1-26+ OVA-specific T cells in red and CD4 and CD8 in brown. (D) Staining with peanut agglutinin (PNA) to detect GCs in red, and with KJ1-26 to detect OVA-specific T cells in brown. Sections are from draining LNs of mice that received OVA-specific CD4 T cells and were immunized with OVA peptide subcutaneously in CFA 3 (A), 5 (B), or 10 (D) d before isolation, or intravenously in saline (C) 3 d before isolation. (E and F) In situ hybridization analysis of BLC expression pattern in LNs containing secondary follicles. BLC hybridization is seen as dark blue staining, and sections are costained in brown for B220 (E) or PNA (F). The capsular staining in E was also seen in controls and is nonspecific. FO, follicle; T, T cell zone; FM, follicular mantle region. Original magnifications: A, C, E, and F, ×10; B and D, ×5.
Figure 1
Figure 1
CXCR5 upregulation by in vivo–activated OVA-specific T cells. (A–E) Histograms depict CXCR5 expression on non–OVA-specific CD4 cells (KJ1-26) and on gated KJ1-26+B220CD8 cells from mice that were treated as follows: (A) unimmunized; (B–E) immunized with OVA peptide subcutaneously in CFA (s.c. KJ1-26+) or intravenously in saline (i.v. KJ1-26+); (F) immunized with OVA protein in LPS. In A, the level of CXCR5 expression on B cells is shown for comparison (dashed line). In B–F, the number of days elapsed between immunization and analysis is displayed in each panel. No Ag, no antigen injected. The experiment shown in F was performed at a different time from A–E, and has a different level of background staining. Results are representative of at least three independent experiments at each time point except panel F, which is representative of two experiments.
Figure 4
Figure 4
BLC chemotactic response of in vivo–activated OVA-specific T cells and memory phenotype CXCR5-expressing T cells. Results are expressed as percentage of transmigrated input cells. Lines represent means of duplicate transwells. (A) Chemotactic response of KJ1-26+CD4+ cells from draining LNs of Balb/c recipients of OVA-specific CD4 T cells immunized 7 d before analysis with OVA peptide subcutaneously in CFA (•) or intravenously in saline (○). Results were similar at day 5 after immunization and are representative of five independent experiments. (B) Kinetic analysis of OVA-specific T cell acquisition of BLC responsiveness. The day after immunization with OVA peptide subcutaneously in CFA is indicated in each panel. Differences in basal migration levels were not reproducible and reflect assay to assay variability. Results are representative of at least two independent experiments at each time point. (C) CXCR5 expression on KJ1-26+CD4+ cells from day 3 draining LNs showing the total input population (Input) and the cells that migrated to BLC (Migrated). (D) CXCR5 and L-selectin (CD62L) expression on CD4+ splenocytes from young (left panel) and 21-mo-old (right panel) B6 mice. Numbers represent the percentage of CD4+ and lymphocyte size-gated cells in each quadrant. Similar results, with progressive accumulation of L-selectinlo and CXCR5hi T cells, were obtained for more than 10 animals <3 or >12 mo of age. (E) Chemotactic response of CXCR5hi (♦) and CXCR5lo/− (⋄) CD4+ T cells, and of B cells (□) from the spleen of a 21-mo-old mouse. The y-axis on the left refers to T cells, and on the right to B cells. Results are representative of eight independent experiments.
Figure 3
Figure 3
Antigen-specific CD4 T cell expression of CXCR5 during a primary immune response. (A) Representative probability contours for CD44 and CXCR5 expression on Vα11Vβ3-expressing T cells over the course of a primary response. All profiles are presented as 5% probability contours with outliers, and are propidium iodide CD8B220CD11bVα11+Vβ3+. The day after antigen administration is displayed above each panel. The quadrants are defined by the horizontal dotted lines, and indicate the limits of CD44 and CXCR5 regulation that were used to calculate the frequencies of cellular subsets. (B) Frequencies of Vα11Vβ3-expressing T cells that have upregulated CD44 and are either CXCR5 (left panel) or CXCR5+ (right panel). (C) The total number of antigen-activated Vα11Vβ3-expressing T cells in the draining LNs as calculated using the frequencies obtained by flow cytometry and total cell counts estimated when organs were harvested; the left panel represents the CXCR5 subset, the right panel represents the CXCR5+ subset. Each estimation (B and C) is presented as the mean from at least three separate animals ± SEM.
Figure 5
Figure 5
Chemotactic response profiles of in vivo–activated OVA-specific T cells and memory phenotype CXCR5-expressing T cells. Results are expressed as percentage of transmigrated input cells. Bars represent means of duplicate transwells. (A) Chemotaxis of KJ1-26+CD4+ OVA-specific (black bars) and nonspecific CD4+ (white bars) cells from draining LNs of OVA-specific T cell transfer recipients immunized 7 d previously with OVA peptide subcutaneously in CFA. Chemokine concentrations were: BLC, 2 μg/ml; ELC, 0.2 μg/ml; SLC, 0.2 μg/ml; and SDF1, 0.3 μg/ml. Results were similar at day 5 after immunization and are representative of at least three independent experiments for each chemokine. (B) Response of KJ1-26+CD4+ OVA-specific (black bars) and nonspecific CD4+ (white bars) cells to 0.2 μg/ml ELC. Cells are from draining LNs of transfer recipients immunized with OVA peptide subcutaneously in CFA (solid bars) or intravenously in saline (hatched bars). The day after immunization is indicated on the x-axis. Data at day 5 are representative of five experiments for subcutaneous immunization in CFA and two experiments for intravenous immunization in saline. (C) Chemotaxis of CXCR5lo/− (white bars) and CXCR5hi (black bars) CD4+ T cells from the spleen of a 21-mo-old mouse. Chemokine concentrations were: BLC, 2 μg/ml; ELC, 0.5 μg/ml; SLC, 0.8 μg/ml; and SDF1, 0.3 μg/ml. Results are representative of at least four independent experiments for each chemokine. CXCR5hi T cells exhibited reduced responsiveness to ELC (0.02–1.5 μg/ml) and SLC (0.08–1.2 μg/ml) at all chemokine concentrations tested.
Figure 6
Figure 6
Transferred MRL-lpr DN T cells, but not memory phenotype CXCR5hi T cells, home towards B cell follicles in secondary lymphoid organs of unimmunized nonautoimmune mice. Spleen (A and B), LN (C), and Peyer's patch (PP; D) sections from syngeneic recipients of CFSE-labeled (A) CD4+ CXCR5+-enriched splenocytes from 12–15-mo-old mice or (B–D) purified DN T cells from 8-mo-old MRL-lpr mice. Recipient tissues were isolated 1 d after cell transfer. CFSE-labeled cells are green. T cells are stained in red using mAbs to CD3∈ and Thy1.2 (A and B), CD8 (C), or CD4 (D). MOMA-1+ marginal zone metallophilic macrophages are stained blue. A is representative of five and B–D of three mice. F, follicle; T, T cell zone; MZ, marginal zone. Original magnification: ×10.
Figure 7
Figure 7
CXCR5 expression and chemotactic response profile of DN T cells from MRL-lpr mice. (A) CXCR5 expression on DN (Thy1+B220+) and conventional (Thy1+B220) T cells. DN T cells stained with the secondary antibody alone (no 1° Ab) are shown as a control. (B and C) Chemotaxis of a 3:1 mixture of MRL-lpr and B6 splenocytes in response to (B) BLC and (C) a panel of lymphoid chemokines. Results are expressed as percentage of input cells transmigrated for DN T cells (•) and conventional T cells (○). Chemokine concentrations in C: BLC, ELC, and SLC, 1 μg/ml; SDF1, 0.3 μg/ml. MRL-lpr mice were old 5 mo at the time of analysis. Lines (B) and bars (C) represent means of duplicate transwells. Results in A are representative of three, and in B and C of two independent experiments.

Similar articles

Cited by

References

    1. MacLennan I.C.M. Germinal centers. Annu. Rev. Immunol. 1994;12:117–139. - PubMed
    1. Kelsoe G. The germinal centera crucible for lymphocyte selection. Semin. Immunol. 1996;8:179–184. - PubMed
    1. Cyster J.G. Signaling thresholds and interclonal competition in preimmune B-cell selection. Immunol. Rev. 1997;156:87–101. - PubMed
    1. Van den Eertwegh A.J.M., Noelle R.J., Roy M., Shepherd D.M., Aruffo A., Ledbetter J.A., Boersma W.J.A., Claassen E. In vivo CD40–gp39 interactions are essential for thymus-dependent humoral immunity. I. In vivo expression of CD40 ligand, cytokines, and antibody production delineates sites of cognate T–B cell interactions. J. Exp. Med. 1993;178:1555–1565. - PMC - PubMed
    1. Toellner K.M., Gulbranson-Judge A., Taylor D.R., Sze D.M., MacLennan I.C. Immunoglobulin switch transcript production in vivo related to the site and time of antigen-specific B cell activation. J. Exp. Med. 1996;183:2303–2312. - PMC - PubMed

Publication types

MeSH terms