. 1999 Nov;19(11):7357-68.
doi: 10.1128/MCB.19.11.7357.

A sampling of the yeast proteome

Affiliations

A sampling of the yeast proteome

B Futcher et al. Mol Cell Biol. 1999 Nov.

Abstract

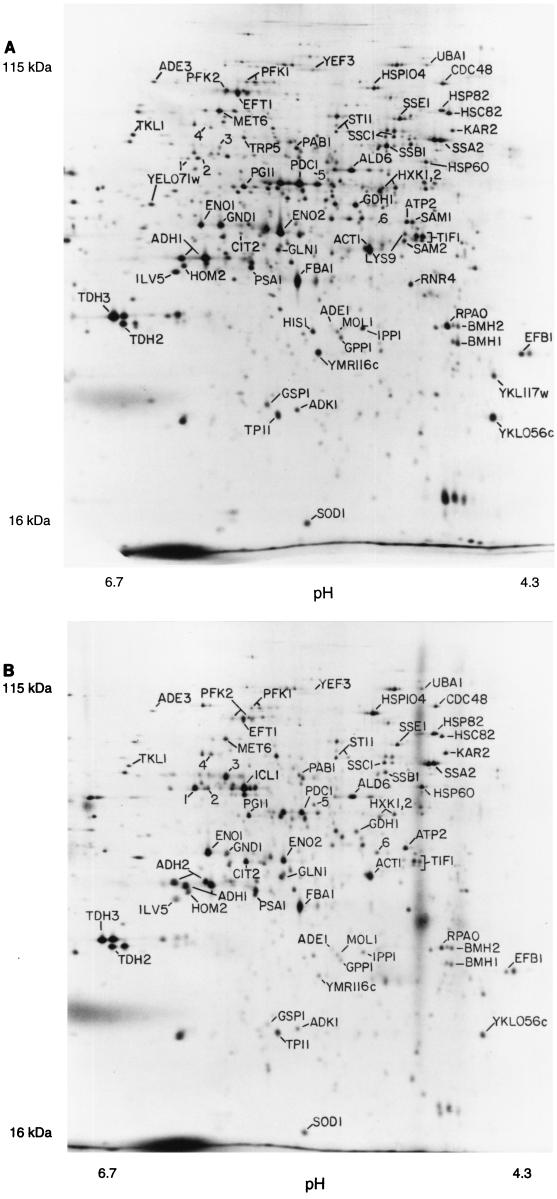
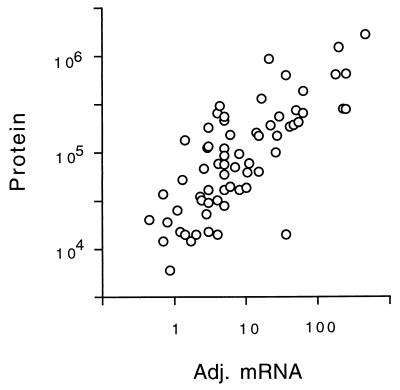
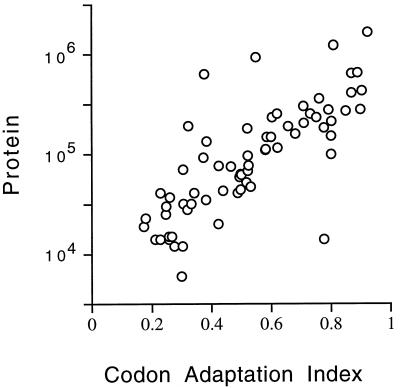
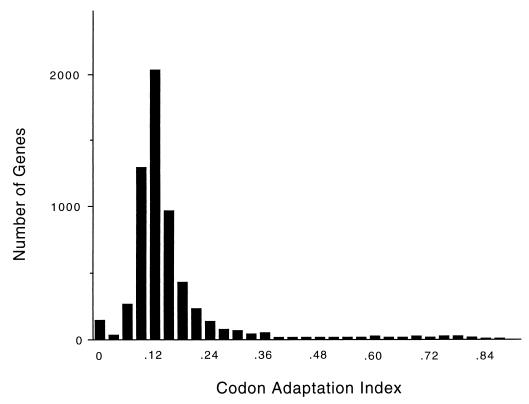
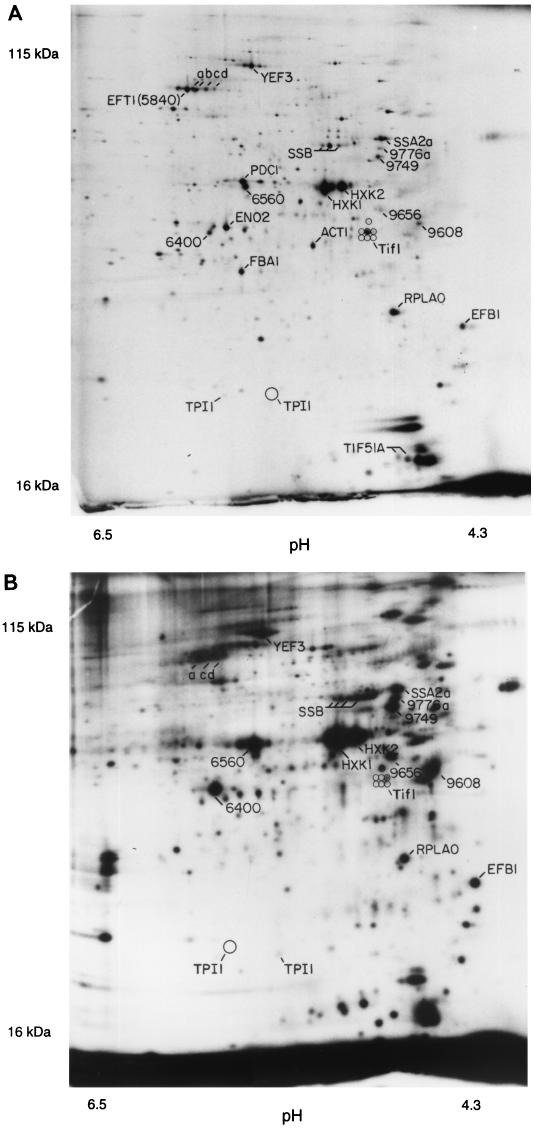
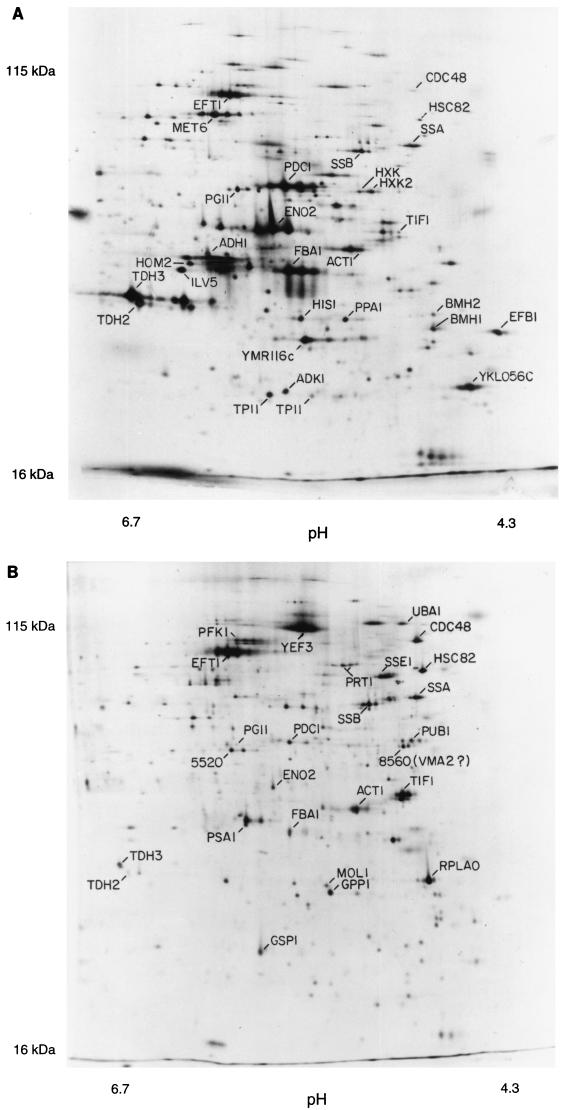
In this study, we examined yeast proteins by two-dimensional (2D) gel electrophoresis and gathered quantitative information from about 1,400 spots. We found that there is an enormous range of protein abundance and, for identified spots, a good correlation between protein abundance, mRNA abundance, and codon bias. For each molecule of well-translated mRNA, there were about 4,000 molecules of protein. The relative abundance of proteins was measured in glucose and ethanol media. Protein turnover was examined and found to be insignificant for abundant proteins. Some phosphoproteins were identified. The behavior of proteins in differential centrifugation experiments was examined. Such experiments with 2D gels can give a global view of the yeast proteome.


Figures

FIG. 1
FIG. 1
2D gels. The horizontal axis is the isoelectric focusing dimension, which stretches from pH 6.7 (left) to pH 4.3 (right). The vertical axis is the polyacrylamide gel dimension, which stretches from about 15 kDa (bottom) to at least 130 kDa (top). For panel A, extract was made from cells in log phase in glucose; for panel B, cells were grown in ethanol. The spots labeled 1 through 6 are unidentified proteins highly induced in ethanol.
FIG. 2
FIG. 2
Correlation of protein abundance with adjusted mRNA abundance. The number of molecules per cell of each protein is plotted against the number of molecules per cell of the cognate mRNA, with an rp of 0.76. Note the logarithmic axes. Data for mRNA were taken from references and and combined as described in Materials and Methods.
FIG. 3
FIG. 3
Correlation of protein abundance with CAI. The number of molecules per cell of each protein is plotted against the CAI for that protein. Note the logarithmic scale on the protein axis. Data for the CAI are from the YPD database (13).
FIG. 4
FIG. 4
Distribution of CAI over the whole genome, shown in intervals of 0.030 (i.e., there are 150 genes with a CAI between 0.000 and 0.030, inclusive; 31 genes with a CAI between 0.031 and 0.060; 269 genes with a CAI between 0.061 and 0.090; 1,296 genes with a CAI between 0.091 and 0.120; etc.). The distribution peaks with 2,028 genes with a CAI between 0.121 and 0.150.
FIG. 5
FIG. 5
Phosphorylated proteins. (A) Mixture of 32P-labeled proteins and 35S-labeled proteins. Two separate labeling reactions were done, one with 32P and one with 35S, and extracts were mixed and run on a 2D gel. Spots marked with numbers rather than gene names represent spots noted on 35S gels but unidentified. Spots labeling with 32P were identified by (i) increased labeling compared to the 35S-only gel (not shown); (ii) the characteristic fuzziness of a 32P-labeled spot; and (iii) the decay of signal intensity seen on exposures made 4 weeks later (not shown). A minor form of Tpi1 and at least six minor forms of Tif1 have been noted in overexpression experiments (see also Fig. 6B); positions of the minor forms are indicated by circles. (B) 32P-only labeling. The major form of Tpi1, which is not labeled with 32P, is indicated by a large circle; positions of seven forms of Tif1 are indicated by smaller circles.
FIG. 6
FIG. 6
Fractionation by centrifugation. (A) Proteins in the supernatant of a 100,000 × g, 30-min spin; proteins in the pellet of a 16,000 × g, 10-min spin. Supernatant fractions examined in multiple experiments done over a wide range of g forces looked similar to each other, as did the pellet fractions.

References

    1. Baroni M D, Martegani E, Monti P, Alberghina L. Cell size modulation by CDC25 and RAS2 genes in Saccharomyces cerevisiae. Mol Cell Biol. 1989;9:2715–2723. - PMC - PubMed
    1. Boucherie H, Sagliocco F, Joubert R, Maillet I, Labarre J, Perrot M. Two-dimensional gel protein database of Saccharomyces cerevisiae. Electrophoresis. 1996;17:1683–1699. - PubMed
    1. Elliott B, Futcher B. Stress resistance of yeast cells is largely independent of cell cycle phase. Yeast. 1993;9:33–42. - PubMed
    1. Entian K D, Meurer B, Kohler H, Mann K H, Mecke D. Studies on the regulation of enolases and compartmentation of cytosolic enzymes in Saccharomyces cerevisiae. Biochim Biophys Acta. 1987;923:214–221. - PubMed
    1. Ganzhorn A J, Green D W, Hershey A D, Gould R M, Plapp B V. Kinetic characterization of yeast alcohol dehydrogenases. Amino acid residue 294 and substrate specificity. J Biol Chem. 1987;262:3754–3761. - PubMed

Publication types

MeSH terms