

Leptin protects mice from starvation-induced lymphoid atrophy and increases thymic cellularity in ob/ob mice
- PMID: 10525043
- PMCID: PMC408574
- DOI: 10.1172/JCI6762
Leptin protects mice from starvation-induced lymphoid atrophy and increases thymic cellularity in ob/ob mice
Abstract
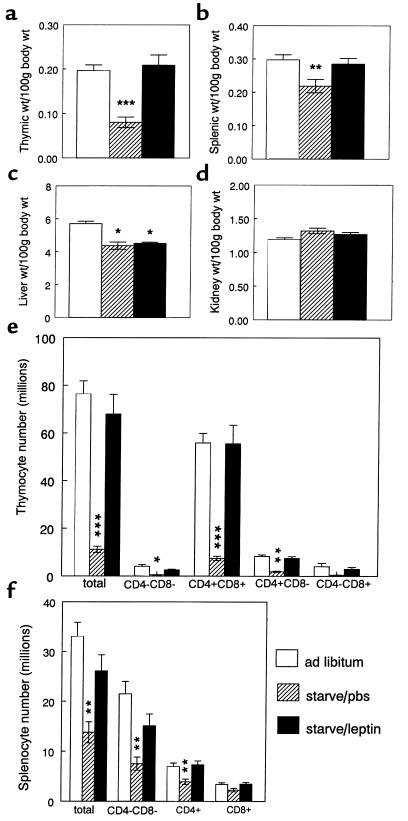
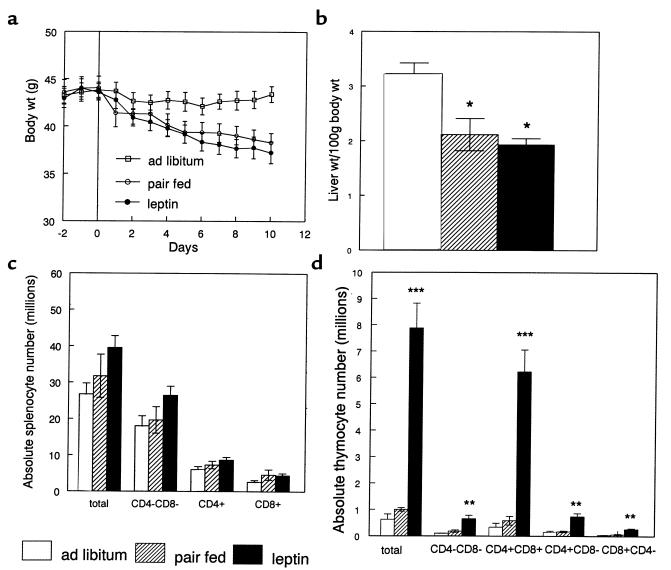
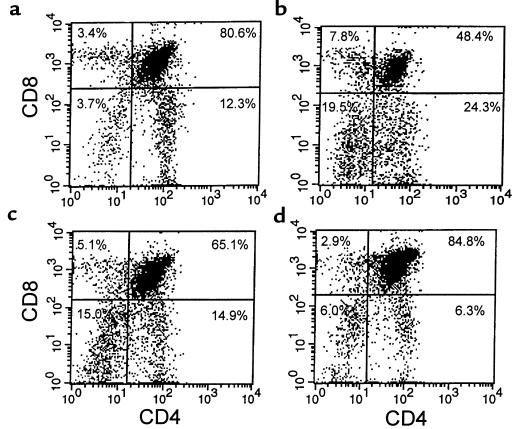
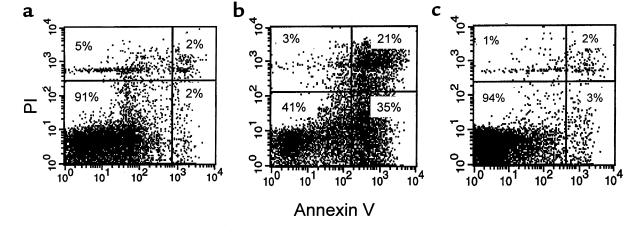
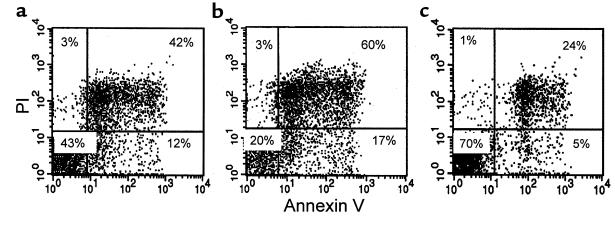
Thymic atrophy is a prominent feature of malnutrition. Forty-eight hours' starvation of normal mice reduced the total thymocyte count to 13% of that observed in freely fed controls, predominantly because of a diminution in the cortical CD4(+)CD8(+) thymocyte subpopulation. Prevention of the fasting-induced fall in the level of the adipocyte-derived hormone leptin by administering exogenous recombinant leptin protected mice from these starvation-induced thymic changes. The ob/ob mouse, which is unable to produce functional leptin because of a mutation in the obese gene, has impaired cellular immunity together with a marked reduction in the size and cellularity of the thymus. We found that ob/ob mice had a high level of thymocyte apoptosis resulting in a ratio of CD4(+)CD8(+) (cortical) to CD4(-)CD8(-) (precursor) thymocytes that was 4-fold lower than that observed in wild-type mice. Peripheral administration of recombinant leptin to ob/ob mice reduced thymocyte apoptosis and substantially increased both thymic cellularity and the CD4(+)CD8(+)/CD4(-)CD8(-) ratio. In contrast, a comparable weight loss in pair-fed PBS-treated ob/ob mice had no impact on thymocyte number. In vitro, leptin protected thymocytes from dexamethasone-induced apoptosis. These data indicate that reduced circulating leptin concentrations are pivotal in the pathogenesis of starvation-induced lymphoid atrophy.
Figures

References
-
- Zhang Y, et al. Positional cloning of the mouse obese gene and its human homologue. Nature. 1994;372:425–432. - PubMed
-
- Considine RV, et al. Serum immunoreactive-leptin concentrations in normal-weight and obese humans. N Engl J Med. 1996;334:292–295. - PubMed
-
- Maffei M, et al. Leptin levels in human and rodent: measurement of plasma leptin and ob RNA in obese and weight-reduced subjects. Nat Med. 1995;1:1155–1161. - PubMed
-
- Ahima RS, et al. Role of leptin in the neuroendocrine response to fasting. Nature. 1996;382:250–252. - PubMed
-
- Boden G, Chen X, Mozzoli M, Ryan I. Effect of fasting on serum leptin in normal human subjects. J Clin Endocrinol Metab. 1996;81:3419–3423. - PubMed
Publication types
MeSH terms
Substances
LinkOut - more resources
Full Text Sources
Other Literature Sources
Molecular Biology Databases
Research Materials
Miscellaneous
