

Temporal sequence of pulmonary and systemic inflammatory responses to graded polymicrobial peritonitis in mice
- PMID: 10531211
- PMCID: PMC96937
- DOI: 10.1128/IAI.67.11.5642-5650.1999
Temporal sequence of pulmonary and systemic inflammatory responses to graded polymicrobial peritonitis in mice
Abstract
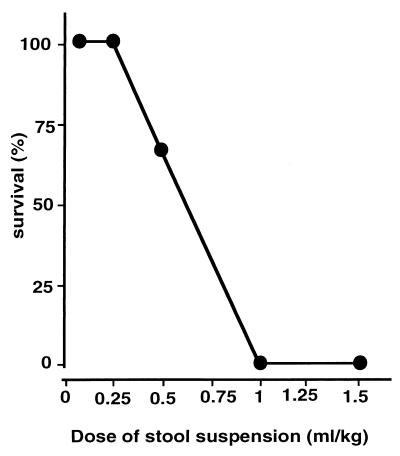
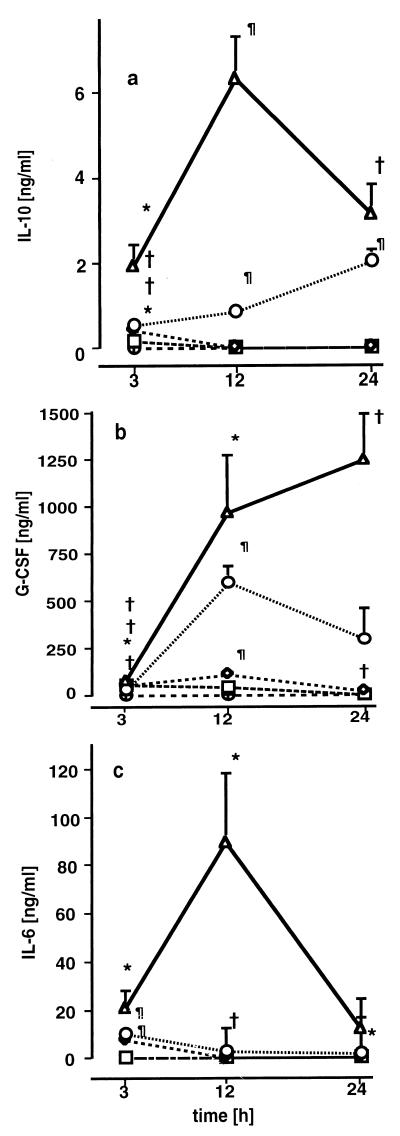
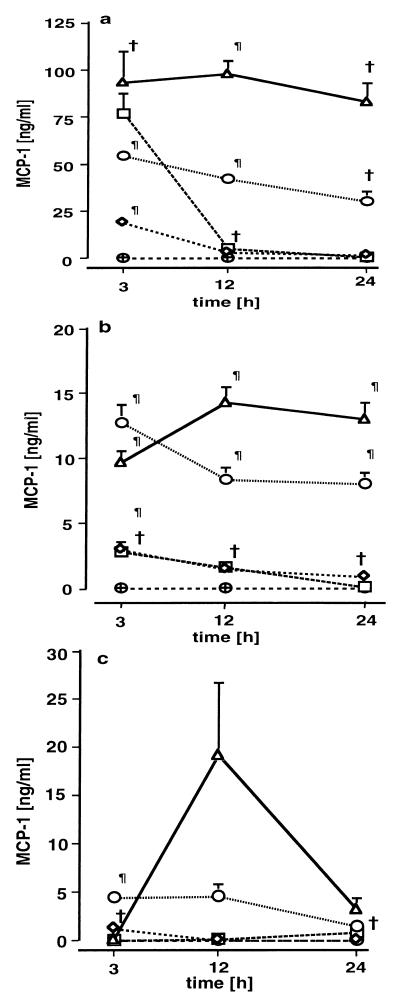
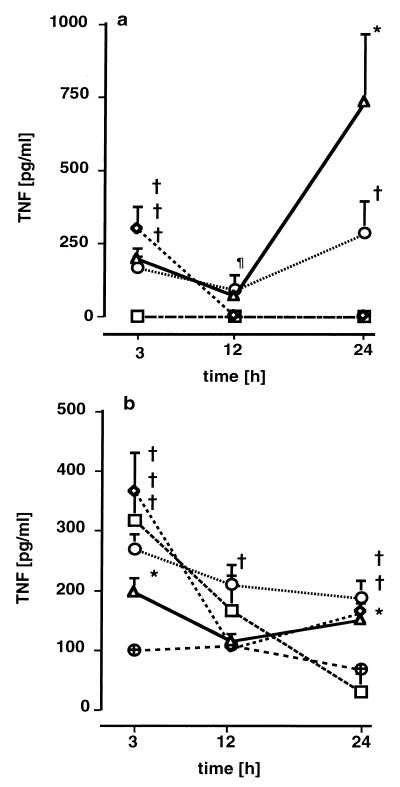
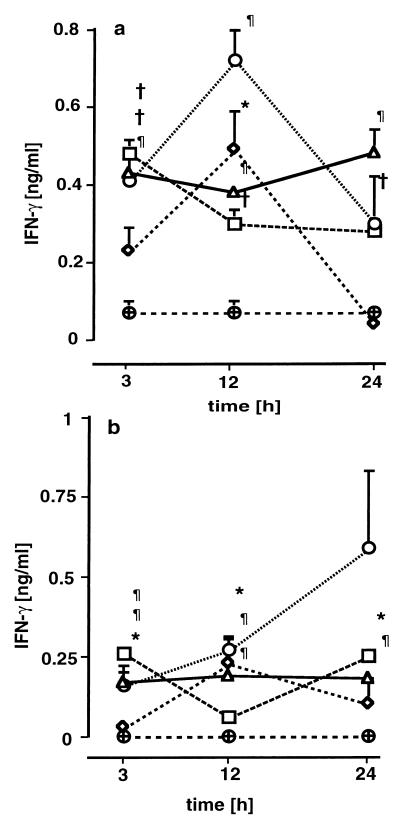
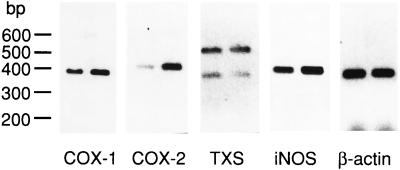
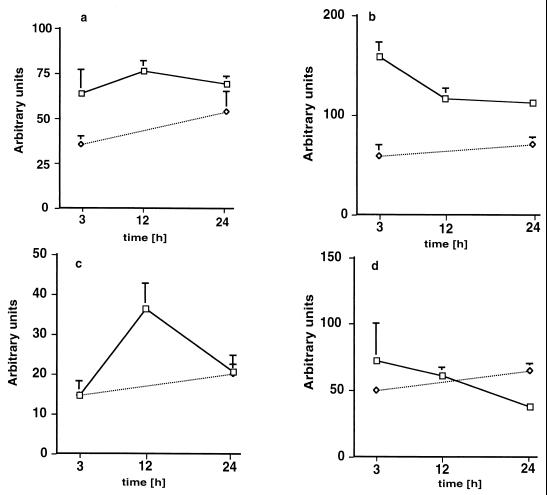
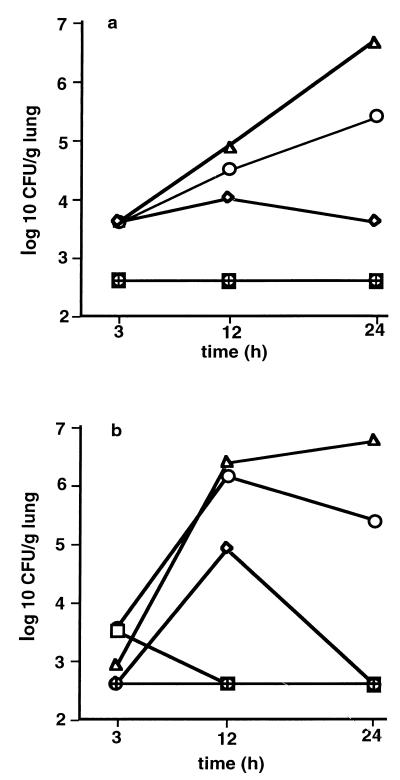
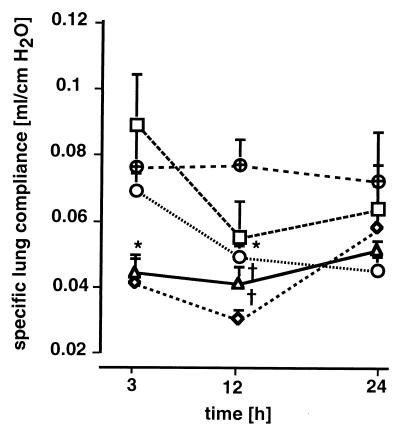
The lungs are the remote organ most commonly affected in human peritonitis. The major goals of this study were to define the dose- and time-dependent relationship between graded septic peritonitis and systemic and pulmonary inflammatory responses in mice. BALB/c mice were treated with intraperitoneal polymicrobial inoculi and sacrificed at 3, 12, and 24 h. The treatment protocol resulted in distinct groups of animals with respect to mortality rate, kinetics, and concentrations of a broad spectrum of pro- and anti-inflammatory endogenous mediators, intrapulmonary bacterial accumulation, and static lung compliance. In sublethally infected mice, pulmonary bacterial proliferation was controlled. Levels of monocyte chemoattractant protein-1 (MCP-1), interleukin-10, interleukin-6, granulocyte colony-stimulating factor (G-CSF), and tumor necrosis factor (TNF) in plasma were elevated 3 h after infection exclusively. At 3 h, MCP-1, gamma interferon, and TNF were detected in extracts of pulmonary tissue or in bronchoalveolar lavage (BAL) fluid. Static lung compliance (C(st)) was transiently decreased at 12 h. In contrast, in lethally infected mice pulmonary bacterial proliferation was not contained. Concentrations of MCP-1, G-CSF, and TNF in plasma were maximal at 24 h, as were pulmonary MCP-1 levels. Lung myeloperoxidase activity was increased at 3, 12, and 24 h. C(st) was reduced after 3 h and did not reach control values at 24 h. Pulmonary cyclooxygenase-2 mRNA and eicosanoids in BAL fluid and plasma were elevated at 3 and 24 h. This study shows that polymicrobial peritonitis in mice leads to dose-dependent systemic and pulmonary inflammation accompanied by a decrease in lung compliance.
Figures
Similar articles
-
Lipopolysaccharide-induced lung inflammation is inhibited by neutralization of GM-CSF.Eur J Pharmacol. 2007 Feb 28;557(2-3):230-5. doi: 10.1016/j.ejphar.2006.11.023. Epub 2006 Nov 14. Eur J Pharmacol. 2007. PMID: 17174948
-
Dependence of positive effects of granulocyte colony-stimulating factor on the antibiotic regimen: evaluation in rats with polymicrobial peritonitis.World J Surg. 2004 Aug;28(8):834-44. doi: 10.1007/s00268-004-7210-1. Epub 2004 Aug 3. World J Surg. 2004. PMID: 15457367
-
Pulmonary and systemic inflammatory responses in rabbits with gram-negative pneumonia.Am J Respir Crit Care Med. 1997 Jun;155(6):2030-40. doi: 10.1164/ajrccm.155.6.9196112. Am J Respir Crit Care Med. 1997. PMID: 9196112
-
Cytokine and eosinophil responses in the lung, peripheral blood, and bone marrow compartments in a murine model of allergen-induced airways inflammation.Am J Respir Cell Mol Biol. 1997 May;16(5):510-20. doi: 10.1165/ajrcmb.16.5.9160833. Am J Respir Cell Mol Biol. 1997. PMID: 9160833
-
Systemic inflammatory response to exhaustive exercise. Cytokine kinetics.Exerc Immunol Rev. 2002;8:6-48. Exerc Immunol Rev. 2002. PMID: 12690937 Review.
Cited by
-
Inhalative IL-10 attenuates pulmonary inflammation following hemorrhagic shock without major alterations of the systemic inflammatory response.Mediators Inflamm. 2012;2012:512974. doi: 10.1155/2012/512974. Epub 2011 Oct 20. Mediators Inflamm. 2012. PMID: 22046081 Free PMC article.
-
Translational approaches to treatment-induced symptoms in cancer patients.Nat Rev Clin Oncol. 2012 May 29;9(7):414-26. doi: 10.1038/nrclinonc.2012.88. Nat Rev Clin Oncol. 2012. PMID: 22641361 Free PMC article. Review.
-
Difficulties in modelling ARDS (2017 Grover Conference Series).Pulm Circ. 2018 Apr-Jun;8(2):2045894018766737. doi: 10.1177/2045894018766737. Epub 2018 Mar 9. Pulm Circ. 2018. PMID: 29521174 Free PMC article.
-
Scientific and clinical challenges in sepsis.Curr Pharm Des. 2009;15(16):1918-35. doi: 10.2174/138161209788453248. Curr Pharm Des. 2009. PMID: 19519432 Free PMC article. Review.
-
Production of IFNβ by Conventional Dendritic Cells after Stimulation with Viral Compounds and IFNβ-Independent IFNAR1-Signaling Pathways are Associated with Aggravation of Polymicrobial Sepsis.Int J Mol Sci. 2019 Sep 7;20(18):4410. doi: 10.3390/ijms20184410. Int J Mol Sci. 2019. PMID: 31500303 Free PMC article.
References
-
- Ayala A, Perrin M M, Kisala J M, Ertel W, Chaudry I H. Polymicrobial sepsis selectively activates peritoneal but not alveolar macrophages to release inflammatory mediators (Interleukins-1 and -6 and tumor necrosis factor) Circ Shock. 1992;36:191–199. - PubMed
-
- Bagby G J, Plessala K J, Wilson L A, Thompson J J, Nelson S. Divergent efficacy of antibody to tumor necrosis factor-α in intravascular and peritonitis models of sepsis. J Infect Dis. 1991;163:83–88. - PubMed
-
- Barsig J, Bundschuh D S, Hartung T, Bauhofer A, Sauer A, Wendel A. Control of fecal peritoneal infection in mice by colony-stimulating factors. J Infect Dis. 1996;174:790–799. - PubMed
-
- Brieland J K, Flory C M, Jones M L, Miller G R, Remick D G, Warren J S, Fantone J C. Regulation of monocyte chemoattractant protein-1 gene expression and secretion in rat pulmonary alveolar macrophages by lipopolysaccharide, tumor necrosis factor-α, and interleukin-1 β. Am J Respir Cell Mol Biol. 1995;12:104–109. - PubMed
-
- Brieland J K, Jones M L, Clarke S J, Baker J B, Warren J S, Fantone J C. Effect of acute inflammatory lung injury on the expression of monocyte chemoattractant protein-1 (MCP-1) in rat pulmonary alveolar macrophages. Am J Respir Cell Mol Biol. 1992;7:134–139. - PubMed
Publication types
MeSH terms
Substances
LinkOut - more resources
Full Text Sources
Medical
Research Materials
Miscellaneous
