. 1999 Nov 1;19(21):9180-91.
doi: 10.1523/JNEUROSCI.19-21-09180.1999.

Multiple and opposing roles of cholinergic transmission in the main olfactory bulb

Affiliations

Multiple and opposing roles of cholinergic transmission in the main olfactory bulb

P E Castillo et al. J Neurosci. .

Abstract

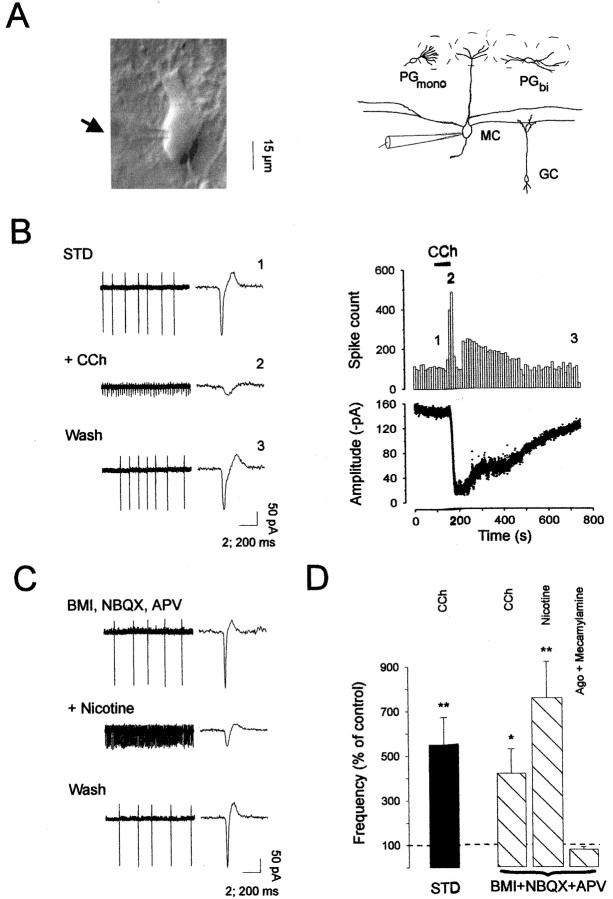
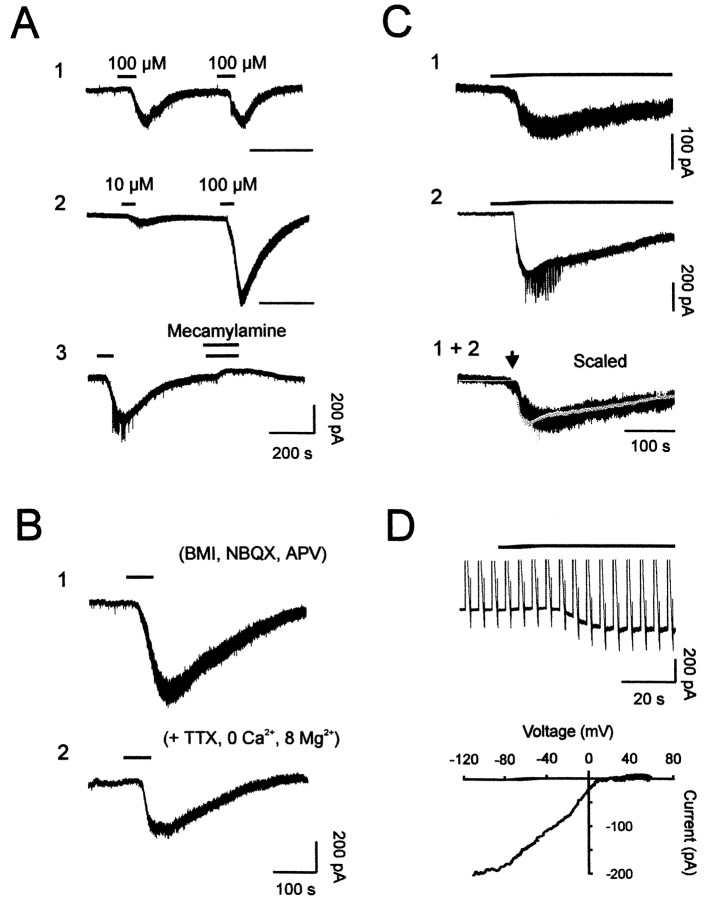
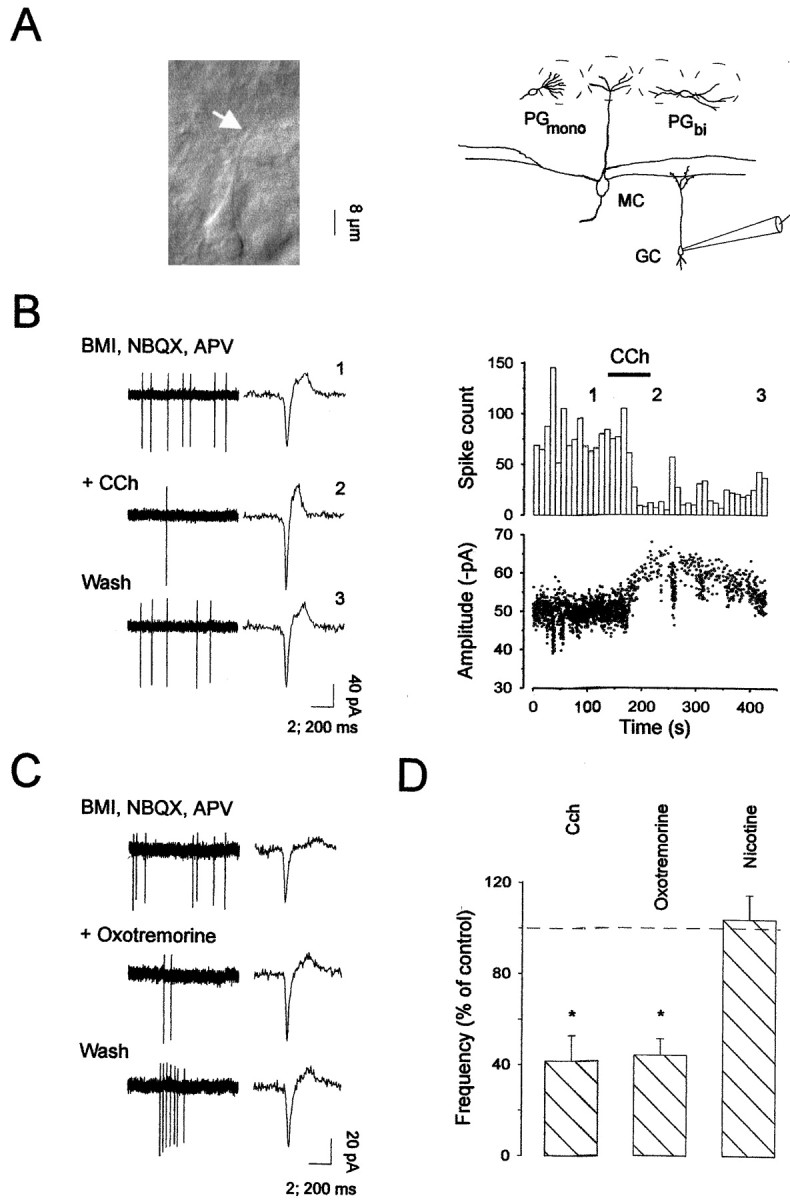
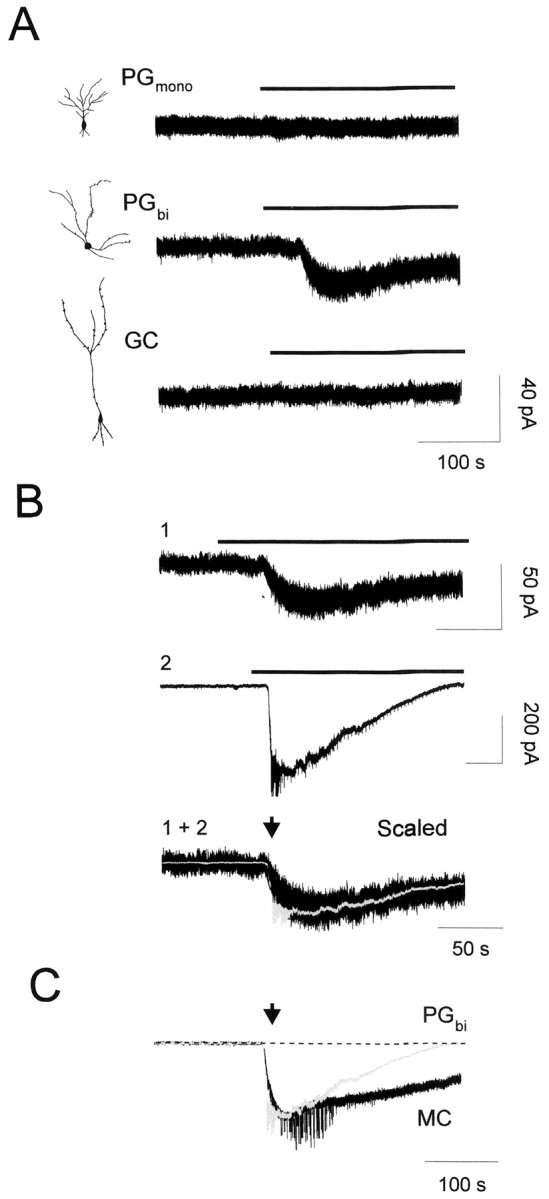
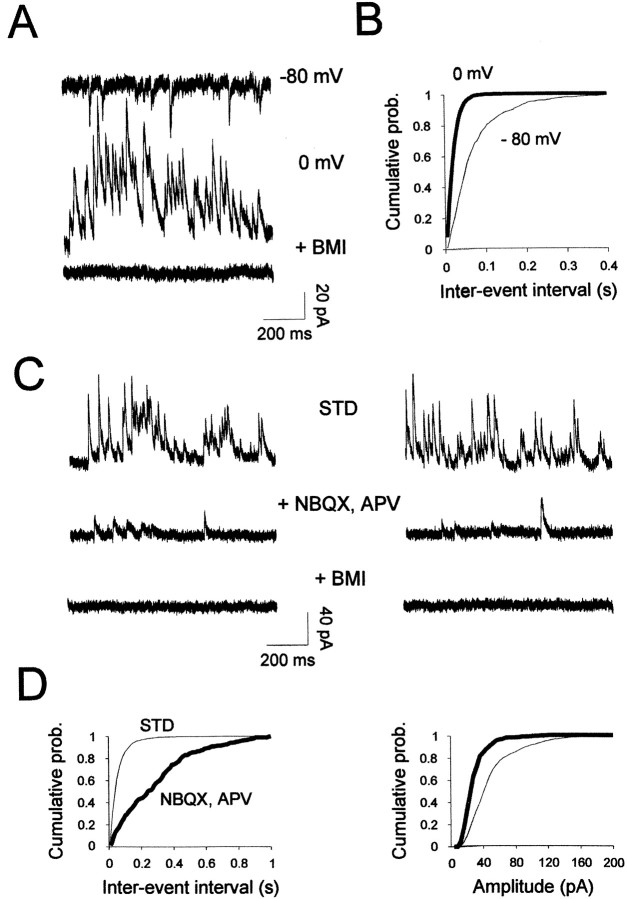
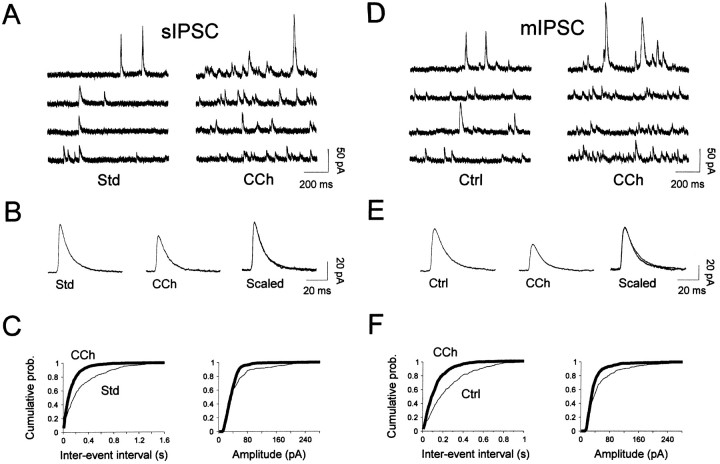
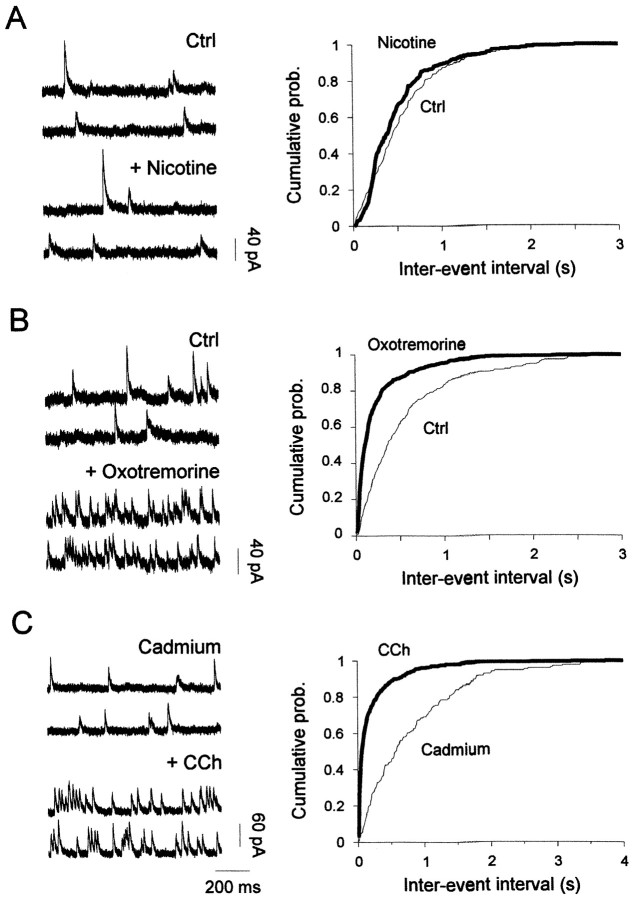
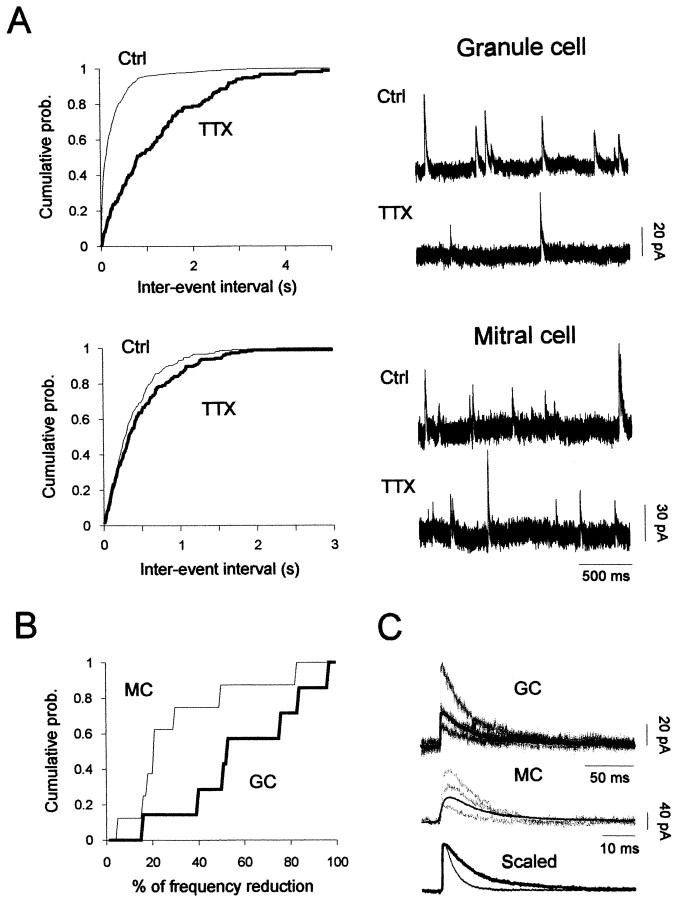
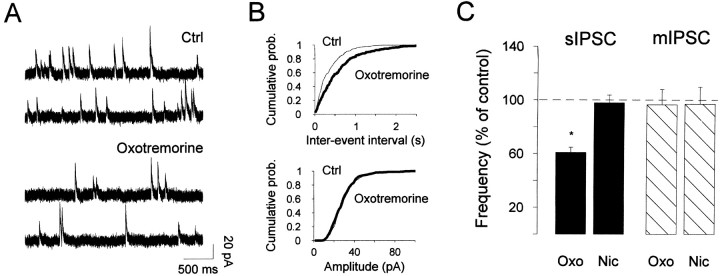
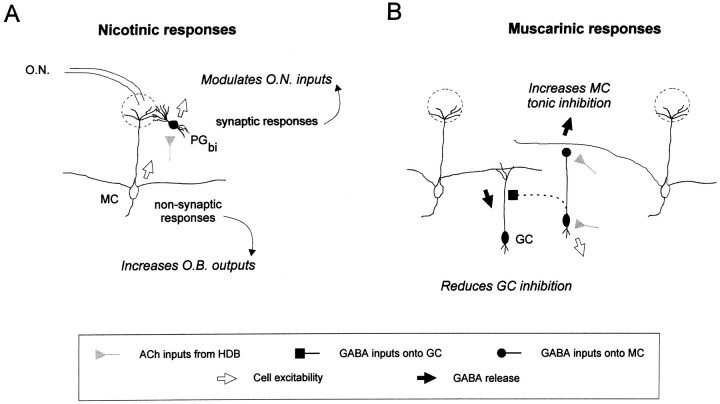
The main olfactory bulb is a critical relay step between the olfactory epithelium and the olfactory cortex. A marked feature of the bulb is its massive innervation by cholinergic inputs from the basal forebrain. In this study, we addressed the functional interaction between cholinergic inputs and intrinsic bulbar circuitry. Determining the roles of acetylcholine (ACh) requires the characterization of cholinergic effects on both neural excitability and synaptic transmission. For this purpose, we used electrophysiological techniques to localize and characterize the diverse roles of ACh in mouse olfactory bulb slices. We found that cholinergic inputs have a surprising number of target receptor populations that are expressed on three different neuronal types in the bulb. Specifically, nicotinic acetylcholine receptors excite both the output neurons of the bulb, i.e., the mitral cells, as well as interneurons located in the periglomerular regions. These nicotine-induced responses in interneurons are short lasting, whereas responses in mitral cells are long lasting. In contrast, muscarinic receptors have an inhibitory effect on the firing rate of interneurons from a deeper layer, granule cells, while at the same time they increase the degree of activity-independent transmitter release from these cells onto mitral cells. Cholinergic signaling thus was found to have multiple and opposing roles in the olfactory bulb. These dual cholinergic effects on mitral cells and interneurons may be important in modulating olfactory bulb output to central structures required for driven behaviors and may be relevant to understanding mechanisms underlying the perturbations of cholinergic inputs to cortex that occur in Alzheimer's disease.


Figures

Fig. 1.
Fig. 1.
Activation of nicotinic receptors enhances mitral cell firing frequency in the main olfactory bulb. A(left), Infrared image of a mitral cell visualized in cell-attached mode under IR-DIC microscopy (arrowindicates the location of the patch electrode) and schema (right) illustrating the location of the recording pipette and the major cell types analyzed in the present study.MC, Mitral cell; GC, granule cell;PGmono, monopolar periglomerular cell; PGbi, bipolar periglomerular cell.B (left), Extracellular recording in cell-attached mode from a mitral cell, in normal conditions (STD), during carbachol (CCh, 50 μm) application, and after drug washout (Wash). Single action potentials are shown on theright side of each trace at an expanded time scale (note the different time calibration bar). B(right), The time courses for changes in action potential frequency (bin size: 10 sec) and amplitude after bath application of CCh are shown (numbersindicate the times of traces chosen for illustration in the left panel). C, Mitral cell firing activity in the presence of BMI (20 μm), NBQX (10 μm), and d,l-APV (100 μm) was increased after bath application of 30 μm nicotine. This nicotine-induced effect was reversible on washout of the drug (Wash).D, Average of the firing frequency changes induced by cholinergic drug applications in different treatments and normalized to the control responses. Changes in frequency were compared between control conditions and drug applications using a pairedt test. Ago: 50 μmcarbachol or 30 μm nicotine (*p< 0.05; **p < 0.01).
Fig. 2.
Fig. 2.
Characterization of nicotine-induced inward currents in mitral cells. A, Repeated applications of nicotine consistently elicited an inward current. Two consecutive bath applications of 100 μm nicotine showed no evidence of rundown (1). This current showed dose dependency (2) and was blocked by 50 μmmecamylamine (3). Sample recordings were taken from three different cells bathed in standard medium. B, The nicotine-induced current was also observed in the presence of a cocktail that included 20 μm BMI, 10 μmNBQX, and 100 μmd,l-APV (1), or on a different cell bathed with extracellular Ca2+ substituted with Mg2+ and containing 1 μm TTX (2). C, Long applications of nicotine revealed a slow decay. Inward currents were obtained from two different mitral cells (1 and 2) and showed identical decay kinetics when scaled (1 + 2). For all cells shown in A–C,Vh = −80 mV. D, Subtraction of currents elicited during a voltage ramp without and with nicotine application reveals the voltage dependence of nicotine-induced current. The recording was performed in the BMI–NBQX–APV mixture supplemented with TTX (1 μm) and Cd2+(200 μm) (top trace). The corresponding current–voltage relationship (bottom) shows inward rectification.
Fig. 3.
Fig. 3.
Muscarinic receptor activation decreases granule cell firing frequency. A, A granule cell visualized under IR-DIC microscopy with the arrow indicating the cell dendrite (left); right, schema of a recorded cell filled with Lucifer yellow. B(left), Extracellular recording in cell-attached mode from a granule cell recorded before, during, and afterCCh (50 μm) (Wash). Single action potentials are shown on the right (note different time calibration bars). B (right), The time course for changes in action potential frequency (bin size: 10 sec) and amplitude during CCh treatment is shown (numbers indicate when traces were extracted for illustration in the left panel).C, Oxotremorine (50 μm) decreased the firing frequency; this effect was reversible on washout (Wash). All granule cells were recorded in a mixture that included BMI (20 μm), NBQX (10 μm), and d,l-APV (100 μm). D, Average of the firing frequency changes induced by cholinergic drug applications in different treatments and normalized to the control responses. Changes in frequency were compared between control medium and drug applications using paired t test (*p < 0.05).
Fig. 4.
Fig. 4.
Selective responses of nicotine on olfactory bulb interneurons. The effect of bath application of nicotine was examined for three interneuron subtypes: monopolar periglomerular cell (PGmono), bipolar periglomerular cell (PGbi), and granule cell (GC). These cells were identified by their location, morphology, and pattern of electrophysiological activity.A, Membrane current traces of individual interneurons showed that only bipolar periglomerular cells respond to nicotine application. Insets, Camera lucida drawings of the Lucifer yellow-filled interneurons performed after whole-cell recordings. B, Inward currents obtained from two different periglomerular interneurons (1 and2) showed identical decay kinetics when scaled (1 + 2). C, Long applications of nicotine revealed a faster decay for a periglomerular cell (PG) than for a mitral cell (MC) shown in Fig.2C2. The holding potential was −80 mV for all recordings.
Fig. 5.
Fig. 5.
GABAergic synaptic events recorded in mitral cells. A, GABAergic spontaneous synaptic currents were recorded at membrane potentials indicated at the rightof the traces. Outward spontaneous currents recorded at 0 mV (middle trace) correspond to pure GABAergic IPSCs because they were completely blocked by 20 μm bicuculline methiodide (+ BMI). B, The distributions of interevent intervals were constructed from 60 sec of continuous data measured at −80 mV (thin line, 784 events) or 0 mV (thick line, 2826 events).C, Spontaneous IPSCs recorded before (STD) and during application of 10 μm NBQX with 100 μmd,l-APV. Subsequent application of BMI (20 μm) completely abolished synaptic activity (bottom traces) (Vh = 0 mV). D, Corresponding cumulative distributions of spontaneous IPSC intervals (left) and amplitudes (right). Plots were constructed from 100 sec of continuous recording. Both frequency and amplitude distributions changed significantly (Kolmogorov–Smirnov test, p< 0.001) in the presence of NBQX–APV (thick line, 305 events; thin line, 1788 events). For this cell, the mean spontaneous IPSC frequency was 17.4 and 3.1 Hz, and mean amplitude was 55 ± 32 pA (SD) and 28 ± 16 pA in STD andNBQX, APV, respectively.
Fig. 6.
Fig. 6.
Carbachol increases the frequency of both spontaneous IPSCs (A–C) and miniature IPSCs (D–F) from mitral cells. A, Sample recordings of spontaneous IPSCs are depicted in standard medium (Std) and after 50 μm carbachol application (CCh). B, Spontaneous IPSCs were averaged and scaled before (Std, 220 events) and after carbachol application (CCh, 191 events). Note that carbachol caused no change in the time course of these events.C, Cumulative probability plots of event frequency (left graph) and amplitude (right graph) were constructed from 125 sec of continuous recording (394 and 967 events in Std and CCh, respectively).CCh enhanced the frequency of spontaneous IPSCs (a mean interevent interval of 0.32 ± 0.4 (SD) sec and 0.13 ± 0.15 sec before and after bath application of carbachol, respectively). The mean spontaneous IPSC amplitude in Std was 49 ± 46 pA (SD) versus 38 ± 31 pA in CCh. Both changes were statistically significant (Kolmogorov–Smirnov test,p < 0.001). D, Sample recordings of miniature IPSCs from a different cell before (Ctrl) and during application of 50 μm carbachol (CCh) in the presence of 1 μm TTX. E, Averaged miniature IPSCs before (Ctrl, 230 events) and during carbachol treatment (CCh, 206 events). As in B, traces are superimposed and scaled on the right (Scaled) to illustrate that carbachol had no effect on the time course of miniature IPSCs. F, Cumulative probability plots of synaptic current frequency and amplitude were constructed from 80 sec of continuous recording (305 and 617 events in Ctrl andCCh, respectively). CCh enhanced the frequency of miniature IPSCs [mean interevent interval of 0.26 ± 0.25 sec (SD) and 0.13 ± 0.12 sec before and after bath application of carbachol, respectively]. The mean miniature IPSC amplitude in controls was 55 ± 54 pA versus 39 ± 29 pA in CCh. Both changes were statistically significant (Kolmogorov–Smirnov test,p < 0.001). D–F, Cells in this figure were recorded in the presence of 10 μm NBQX and 100 μmd,l-APV and voltage-clamped at 0 mV.
Fig. 7.
Fig. 7.
Activation of muscarinic receptors enhances the frequency of miniature IPSCs recorded in mitral cells.A, Miniature IPSCs recorded before and during bath application of 30 μm nicotine (left traces), and corresponding cumulative interval distributions are shown on the right. Nicotine (thick line) had no effect on the miniature IPSC frequency (Kolmogorov–Smirnov test, p > 0.05).B, Recordings from a different cell before and after 50 μm oxotremorine application (left traces). The corresponding cumulative display of interval distributions on theright shows that oxotremorine increased miniature IPSC frequency (Kolmogorov–Smirnov test, p < 0.001). C, Carbachol (+CCh) still increased miniature IPSC frequency in the presence of 100 μm Cd2+(Kolmogorov–Smirnov test, p < 0.001). Cells were voltage-clamped at 0 mV and recorded in normal ACSF with 10 μm NBQX, 100 μmd,l-APV, and 1 μm TTX (Ctrl).
Fig. 8.
Fig. 8.
Two distinct inhibitory synaptic responses in olfactory bulb neurons. A, Spontaneous GABAergic IPSC activity from a granule (top) and a mitral cell (bottom) recorded before and during application of TTX (1 μm). Corresponding cumulative interval distributions are depicted before (thin lines) and in the presence of TTX (thick lines) (mitral cell: 220 events before and 177 events during TTX; granule cell: 664 events before and 147 events during TTX). Note that TTX strongly reduced the frequency of IPSCs from the granule cell. Neurons were recorded in the presence of NBQX and APV and voltage-clamped at 0 mV. B, Cumulative probability distribution of the reduction of IPSC frequency induced by TTX, measured in mitral cells (MC; n = 8) and granule cells (GC; n = 7) (mean reductions of 30 ± 9 and 60 ± 10%, for mitral cells and granule cells, respectively). C, Comparison of spontaneous IPSCs (no TTX included) recorded from a granule cell (GC) and a mitral cell (MC) is shown (top and middle traces). The averaged IPSCs (180 and 250 events, respectively, for granule and mitral cells) are superimposed and scaled (granule-IPSC and mitral-IPSC decay time constants: 40 msec and 10 msec, respectively). Both cells were voltage-clamped at 0 mV.
Fig. 9.
Fig. 9.
Activation of muscarinic receptors decreased the frequency of spontaneous IPSCs recorded in granule cells.A, Spontaneous IPSCs recorded in NBQX–APV before (Std) and during application of 50 μmoxotremorine while voltage-clamping the cell at 0 mV. B,Corresponding interval (top) and amplitude (bottom) cumulative distribution plots were constructed from 150 sec of continuous data before (442 events) and after (261 events) carbachol. The amplitude distribution remained unchanged (Kolmogorov–Smirnov test, p > 0.05; mean amplitude in control, 28.4 vs 28.7 pA in carbachol), whereas the interval distributions were significantly different (Kolmogorov–Smirnov test, p < 0.001).C, Bar graph summarizing the effect of 50 μm oxotremorine (Oxo) and 50 μm nicotine (Nic) on spontaneous IPSC (sIPSC) or miniature IPSC (mIPSC) frequency.
Fig. 10.
Fig. 10.
Schematic representation of cholinergic targets in the main olfactory bulb. This schema summarizes findings from the present study and takes into account previous anatomical observations.A, Cholinergic fibers activate postsynaptic nicotinic receptors located on mitral cells (MC) where ACh may be delivered through a nonsynaptic relationship to act as a neuromodulator and also on bipolar periglomerular cells (PGbi) by a synaptic relationship where ACh rather acts as a neurotransmitter. Through this dual effect, ACh may facilitate the sensory transfer toward upper cortical centers.B, Cholinergic inputs into plexiform layers and granule cell layer allow activation of muscarinic receptors that contribute to a tonic inhibition of output neurons and a reduction of inhibition (disinhibition) onto granule cells. MC, Mitral cell;GC, granule cell; PGbi, bipolar periglomerular cell; O.N., olfactory nerve;HDB, the horizontal limb of the diagonal band of Broca.

Similar articles

Cited by

References

    1. Agnati LF, Zoli M, Strömberg I, Fuxe K. Intercellular communication in the brain: wiring versus volume transmission. Neuroscience. 1995;69:711–726. - PubMed
    1. Alkondon M, Albuquerque EX. Presence of α-bungarotoxin-sensitive nicotinic ACh receptors in rat olfactory bulb neurons. Neurosci Lett. 1994;176:152–156. - PubMed
    1. Alkondon M, Rocha ES, Maelicke A, Albuquerque EX. Diversity of nicotinic ACh receptors in rat brain. V. α-bungarotoxin-sensitive nicotinic receptors in olfactory bulb neurons and presynaptic modulation of glutamate release. J Pharmacol Exp Ther. 1996;278:1460–1471. - PubMed
    1. Alkondon M, Pereira EFR, Eisenberg HM, Albuquerque EX. Choline and selective antagonists identify two subtypes of nicotinic acetylcholine receptors that modulate GABA release from CA1 interneurons in rat hippocampal slices. J Neurosci. 1999;19:2693–2705. - PMC - PubMed
    1. Brown DA, Abogadie FC, Allen TG, Buckley NJ, Caulfield MP, Delmas P, Haley JE, Lamas JA, Selyanko AA. Muscarinic mechanisms in nerve cells. Life Sci. 1997;60:1137–1144. - PubMed

Publication types

MeSH terms

LinkOut - more resources