

Translocation and specific cleavage of bacteriophage T7 DNA in vivo by EcoKI
- PMID: 10535939
- PMCID: PMC22939
- DOI: 10.1073/pnas.96.22.12430
Translocation and specific cleavage of bacteriophage T7 DNA in vivo by EcoKI
Abstract
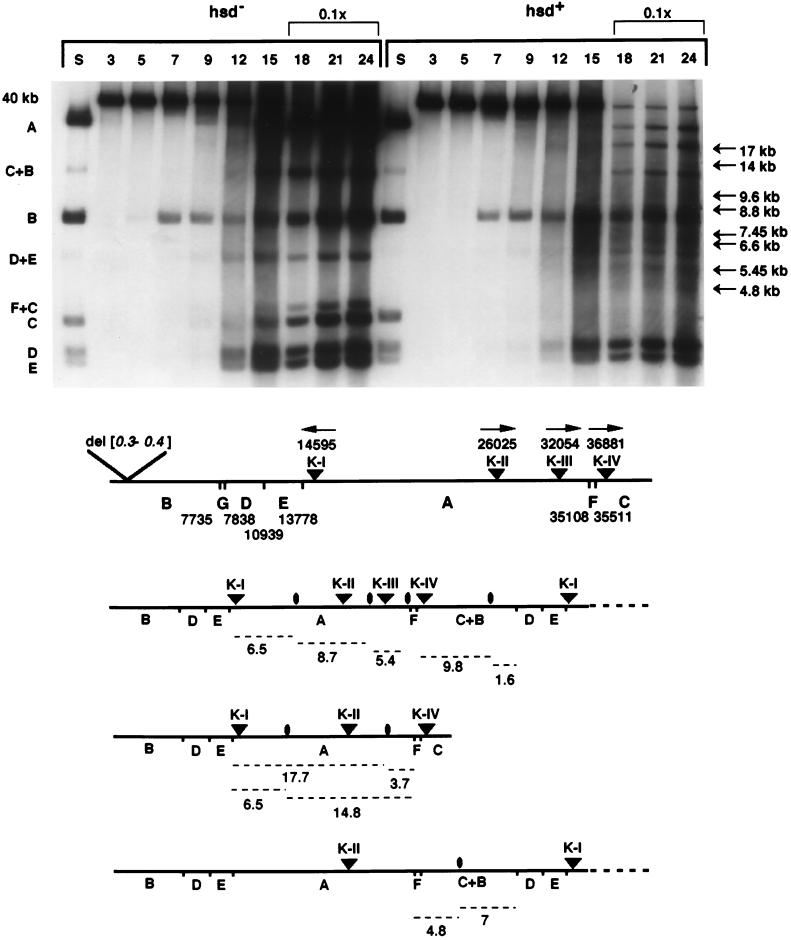
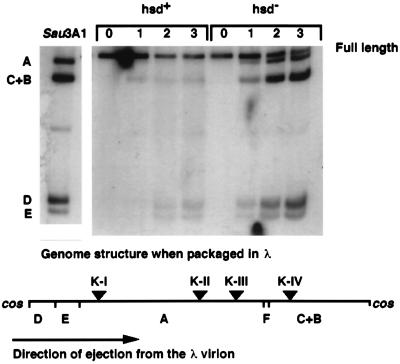
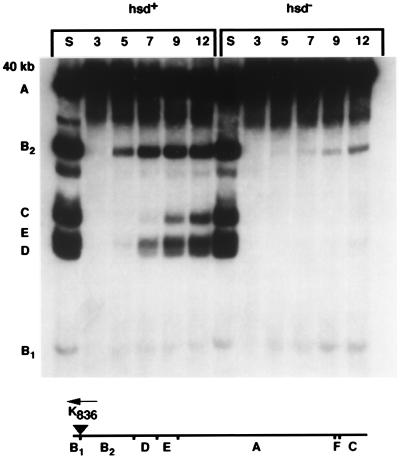
Infection of Escherichia coli containing the type I restriction enzyme EcoKI by bacteriophage T7 0.3 mutants leads to restriction during the late stages of genome entry and during DNA replication. Patterns of cleavage in vivo suggest that some cutting occurs near the midpoint of two recognition sites, consistent with the idea that EcoKI translocates DNA bidirectionally through itself and cuts when two enzyme molecules collide. Rapid ejection of a 0.3(+) T7 genome from a bacteriophage lambda particle results in degradation of the infecting DNA by EcoKI, showing that the normal T7 DNA translocation process delays restriction. A unique recognition site inserted at the genomic left end allows EcoKI to function as a molecular motor and to translocate the remaining 39 kilobases of T7 DNA into the cell.
Figures
Similar articles
-
Rate of translocation of bacteriophage T7 DNA across the membranes of Escherichia coli.J Bacteriol. 1995 Jul;177(14):4066-76. doi: 10.1128/jb.177.14.4066-4076.1995. J Bacteriol. 1995. PMID: 7608081 Free PMC article.
-
The DNA translocation and ATPase activities of restriction-deficient mutants of Eco KI.J Mol Biol. 1999 Oct 1;292(4):787-96. doi: 10.1006/jmbi.1999.3081. J Mol Biol. 1999. PMID: 10525405
-
Tracking EcoKI and DNA fifty years on: a golden story full of surprises.Nucleic Acids Res. 2003 Dec 15;31(24):7059-69. doi: 10.1093/nar/gkg944. Nucleic Acids Res. 2003. PMID: 14654681 Free PMC article.
-
The significance of distance and orientation of restriction endonuclease recognition sites in viral DNA genomes.FEMS Microbiol Rev. 1995 Aug;17(1-2):177-84. doi: 10.1111/j.1574-6976.1995.tb00200.x. FEMS Microbiol Rev. 1995. PMID: 7669344 Review.
-
No syringes please, ejection of phage T7 DNA from the virion is enzyme driven.Mol Microbiol. 2001 Apr;40(1):1-8. doi: 10.1046/j.1365-2958.2001.02357.x. Mol Microbiol. 2001. PMID: 11298271 Review.
Cited by
-
The single polypeptide restriction-modification enzyme LlaGI is a self-contained molecular motor that translocates DNA loops.Nucleic Acids Res. 2009 Nov;37(21):7219-30. doi: 10.1093/nar/gkp794. Nucleic Acids Res. 2009. PMID: 19783815 Free PMC article.
-
Cleavage of a model DNA replication fork by a Type I restriction endonuclease.Nucleic Acids Res. 2009 Jun;37(11):3531-44. doi: 10.1093/nar/gkp214. Epub 2009 Apr 7. Nucleic Acids Res. 2009. PMID: 19357093 Free PMC article.
-
The future of bacteriophage biology.Nat Rev Genet. 2003 Jun;4(6):471-7. doi: 10.1038/nrg1089. Nat Rev Genet. 2003. PMID: 12776216 Free PMC article. Review.
-
Conflicts targeting epigenetic systems and their resolution by cell death: novel concepts for methyl-specific and other restriction systems.DNA Res. 2010 Dec;17(6):325-42. doi: 10.1093/dnares/dsq027. Epub 2010 Nov 8. DNA Res. 2010. PMID: 21059708 Free PMC article. Review.
-
DNA looping and translocation provide an optimal cleavage mechanism for the type III restriction enzymes.EMBO J. 2007 Aug 22;26(16):3815-25. doi: 10.1038/sj.emboj.7601807. Epub 2007 Jul 26. EMBO J. 2007. PMID: 17660745 Free PMC article.
References
Publication types
MeSH terms
Substances
Grants and funding
LinkOut - more resources
Full Text Sources
Molecular Biology Databases
