

Activation changes the spectrum but not the diversity of genes expressed by T cells
- PMID: 10535984
- PMCID: PMC23052
- DOI: 10.1073/pnas.96.22.12691
Activation changes the spectrum but not the diversity of genes expressed by T cells
Abstract
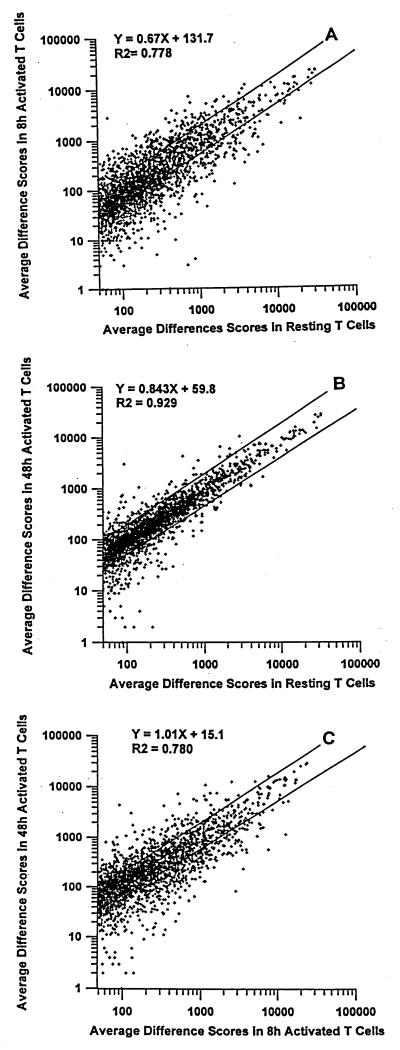
During activation T cells are thought to change their patterns of gene expression dramatically. To find out whether this is true for T cells activated in animals, the patterns of genes expressed in resting T cells and T cells 8 and 48 hr after activation were examined by using Affymetrix gene arrays. Gene arrays gave accurate comparisons of gene expression in the different cell types because the expression of genes known to vary during activation changed as expected. Of the approximately 6,300 genes assessed by the arrays, about one-third were expressed to appreciable extents in any of the T cells tested. Thus, resting T cells express a surprisingly large diversity of genes. The patterns of gene expression changed considerably within 8 hr of T cell activation but returned to a disposition more like that of resting T cells within 48 hr of exposure to antigen. Not unexpectedly, the activated T cells expressed genes associated with cell division at higher levels than resting T cells. The resting T cells expressed a number of cytokine receptor genes and some genes thought to suppress cell division, suggesting that the state of resting T cells is not a passive failure to respond to extant external stimuli.
Figures
References
-
- Zheng W, Flavell R A. Cell. 1997;89:587–596.
-
- Choi J W, Lee S Y, Choi Y. Cell Immunol. 1996;168:78–84. - PubMed
-
- Liu A Y, Torchia B S, Migeon B R, Siliciano R F. Genomics. 1997;39:171–184. - PubMed
-
- Renner C, Pfitzenmeier J P, Gerlach K, Held G, Ohnesorge S, Sahin U, Bauer S, Pfreundschuh M. J Immunol. 1997;159:1276–1283. - PubMed
Publication types
MeSH terms
Substances
Grants and funding
LinkOut - more resources
Full Text Sources
Other Literature Sources
