. 1999 Nov;114(5):723-42.
doi: 10.1085/jgp.114.5.723.

Voltage sensitivity and gating charge in Shaker and Shab family potassium channels

Affiliations

Voltage sensitivity and gating charge in Shaker and Shab family potassium channels

L D Islas et al. J Gen Physiol. 1999 Nov.

Abstract

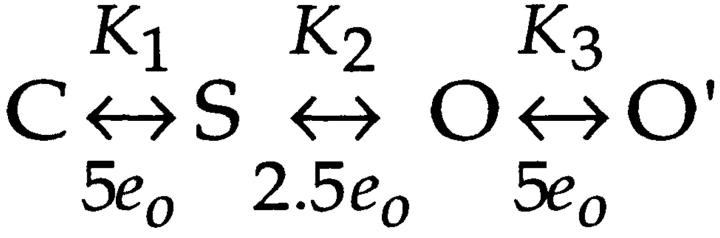
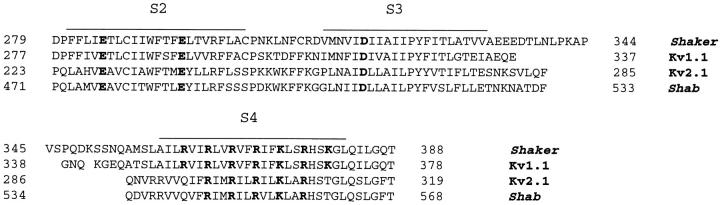
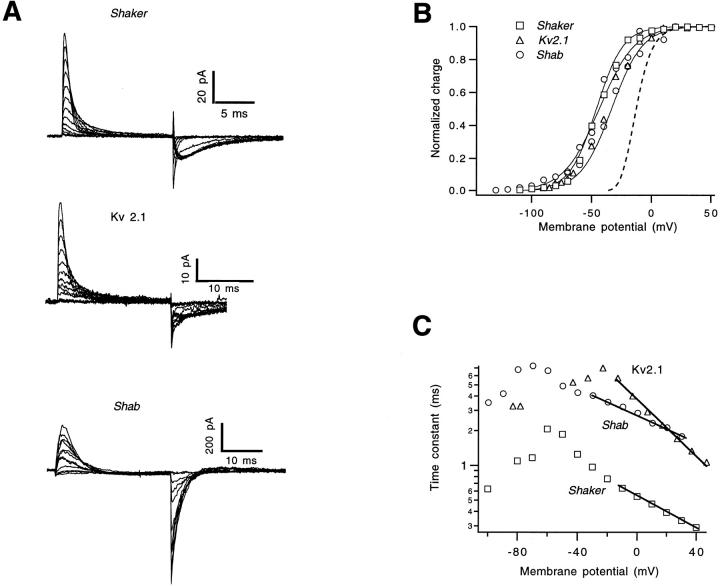
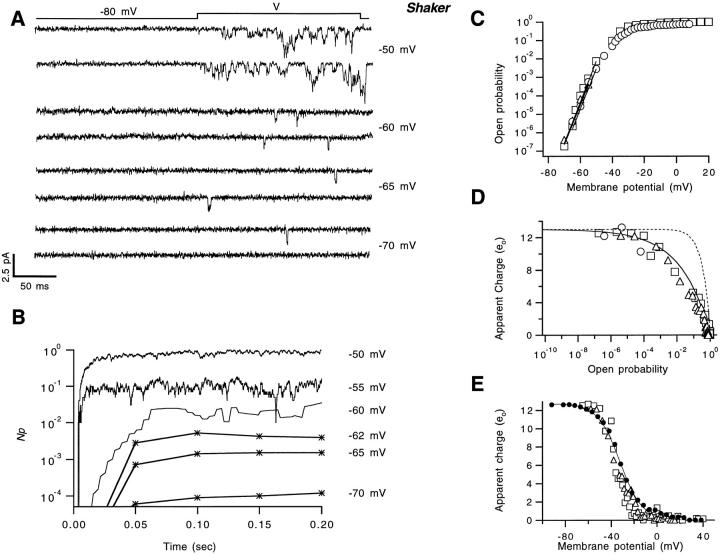
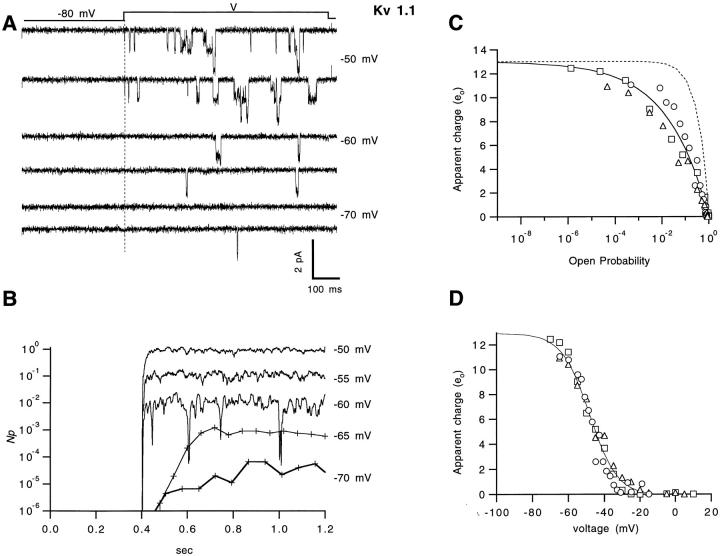
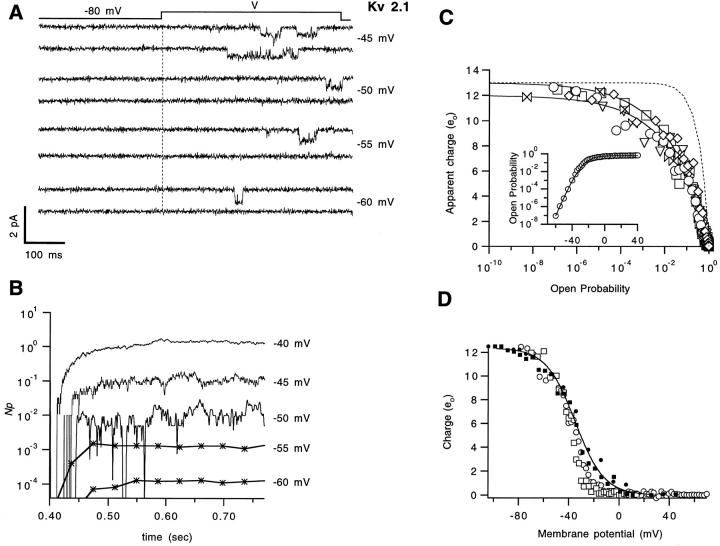
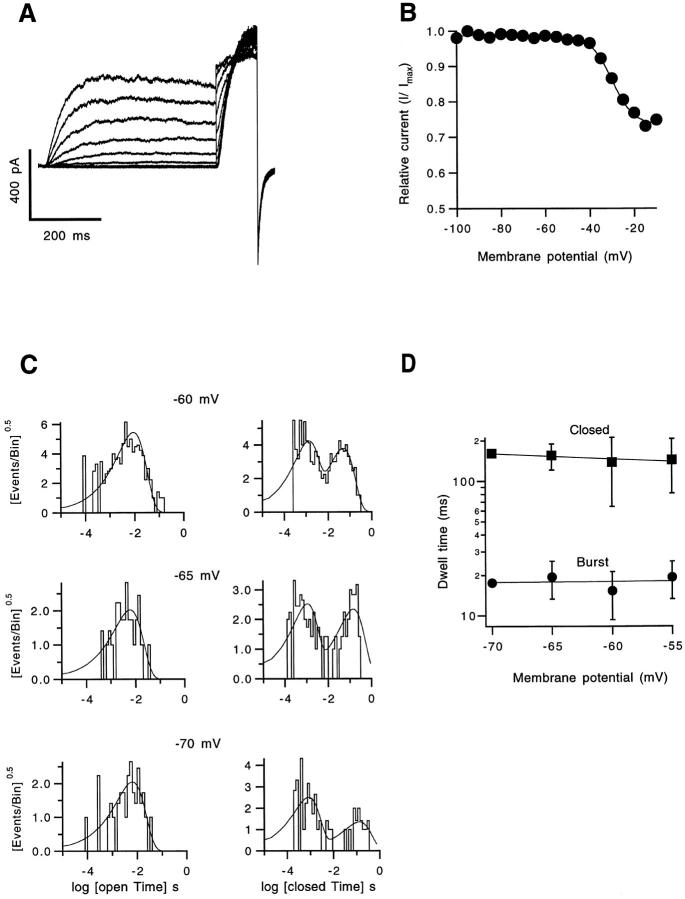
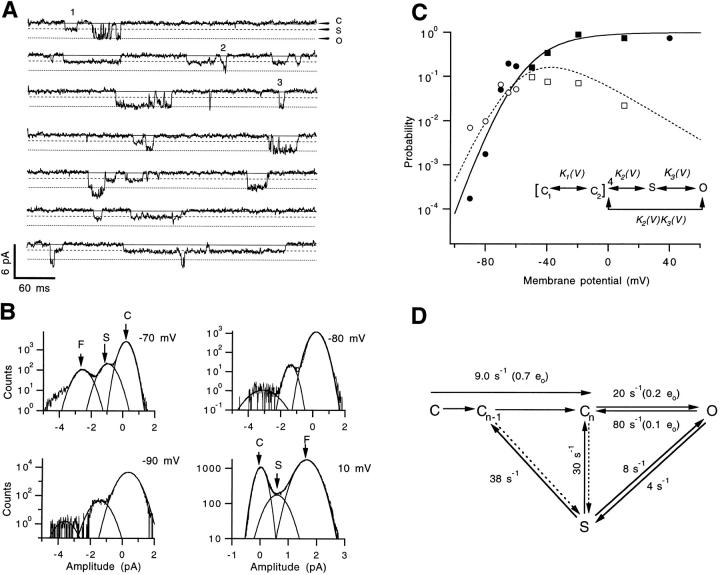
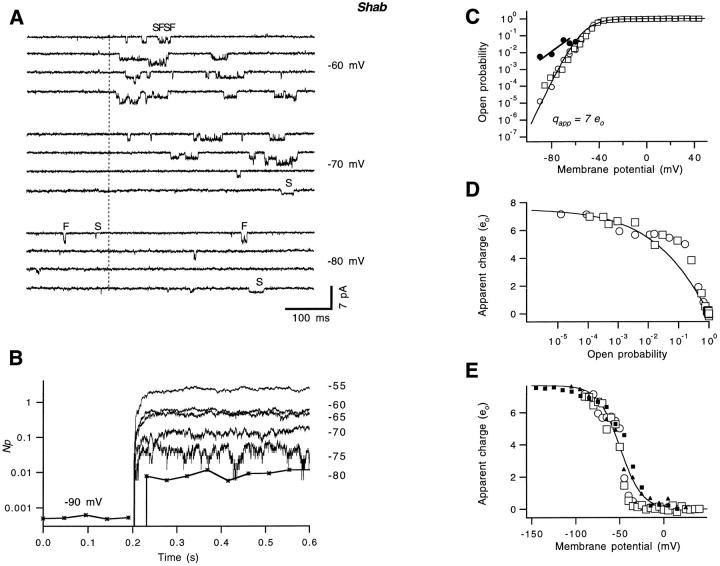
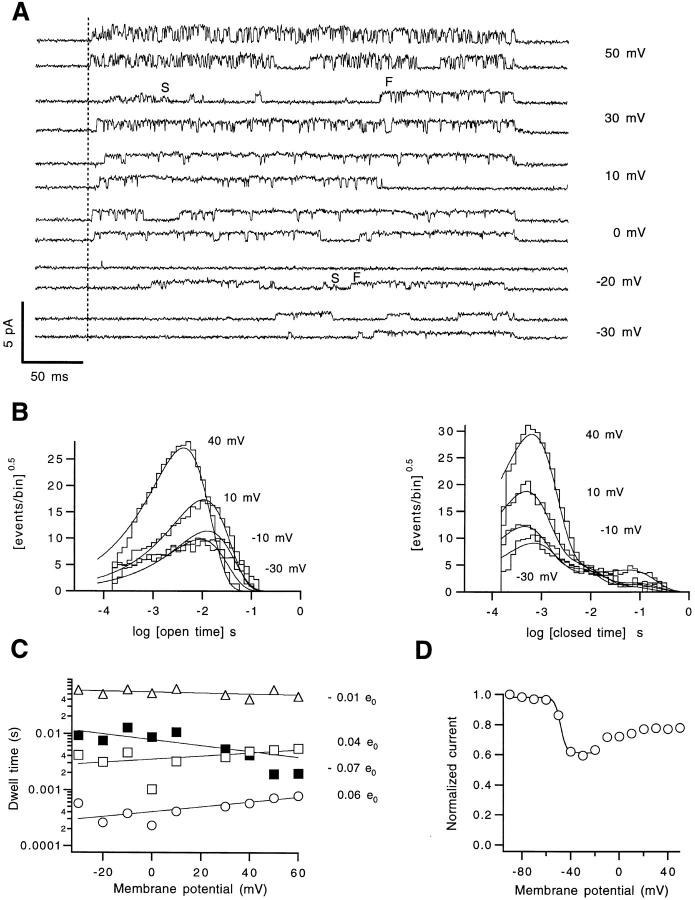
The members of the voltage-dependent potassium channel family subserve a variety of functions and are expected to have voltage sensors with different sensitivities. The Shaker channel of Drosophila, which underlies a transient potassium current, has a high voltage sensitivity that is conferred by a large gating charge movement, approximately 13 elementary charges. A Shaker subunit's primary voltage-sensing (S4) region has seven positively charged residues. The Shab channel and its homologue Kv2.1 both carry a delayed-rectifier current, and their subunits have only five positively charged residues in S4; they would be expected to have smaller gating-charge movements and voltage sensitivities. We have characterized the gating currents and single-channel behavior of Shab channels and have estimated the charge movement in Shaker, Shab, and their rat homologues Kv1.1 and Kv2.1 by measuring the voltage dependence of open probability at very negative voltages and comparing this with the charge-voltage relationships. We find that Shab has a relatively small gating charge, approximately 7.5 e(o). Surprisingly, the corresponding mammalian delayed rectifier Kv2.1, which has the same complement of charged residues in the S2, S3, and S4 segments, has a gating charge of 12.5 e(o), essentially equal to that of Shaker and Kv1.1. Evidence for very strong coupling between charge movement and channel opening is seen in two channel types, with the probability of voltage-independent channel openings measured to be below 10(-9) in Shaker and below 4 x 10(-8) in Kv2.1.


Figures

Scheme S1
Scheme S1
Figure 2
Figure 2
Macroscopic activation properties of Shaker-related potassium channels. (A) Current traces in cell-attached patches in response to depolarizing voltage steps. The holding potential is −80 mV in each case except −90 for Shab. The voltage range for the depolarizations is as follows: Shaker: −58 to 26 mV in 4-mV steps; Kv1.1: −65 to 55 mV in 10-mV steps; Kv2.1: −50 to 40 mV in 5-mV steps; Shab: −70 to 50 mV in 10-mV steps. In each case, the standard pipette solution was used, which contained 60 mM K+. Recordings are from oocyte patches, except for Shab, which is from an Sf9 cell patch. Increased noise in the largest Kv2.1 currents presumably comes from internal Mg2+ block of these channels (Lopatin and Nichols 1994). (B) Voltage dependence of activation obtained from tail currents. The tail current amplitude was taken to be proportional to the open probability at the end of the voltage pulse. Values were normalized to the maximum P obtained from nonstationary noise analysis at 60–70 mV. The P max values are 0.79 for Shaker and 0.82 for Kv1.1. The P(V) relationship was fitted to the fourth power Boltzmann function:P V=P max11+e qkTVV0 4,where V is the voltage in millivolts, q is the charge per subunit in (eo), V o is the half-activation voltage, and kT has its usual meaning. The fitted values are: Shaker, Vo = −27.5 mV and q = 2.88 eo. Kv1.1, V o = −33.4 mV and q = 1.92 eo. (C) Voltage dependence of activation for Kv2.1 and Shab channels. P max values are: Kv2.1, 0.69; Shab, 0.76. The fitted parameters are: Kv2.1, V o = −22.4 mV and q = 2.53 eo. Shab, Vo = −44.9 mV and q = 1.56 eo. (D) Voltage dependence of activation and deactivation time constants τ, and (E) delay of activation δ. The values at voltages above 50 mV, or 0 mV in the case of Kv1.1, were fitted to the functions: τ(V) = τ(0)exp(Vq τ/kT) and δ(V) = δ(0)exp(Vq δ/kT), where q τ and q δ are partial charges associated with the time constant and the delay, respectively. Fitted values are as follows: Kv2.1 (▵): q τ = 0.24 eo, q δ = 0.62 eo; Shab (○): q τ = 0.30 eo, q δ = 0.7 eo; Shaker (□): q τ = 0.51 eo, q δ = 0.22 eo; and Kv1.1 (⋄): q τ = 0.37 eo, q δ = 0.28 eo. The symbols with a dot indicate deactivation time constants derived from exponential fits of tail currents at the indicated potentials for Kv2.1 and Shab. The effective charge q δ in the most negative potential region is Kv2.1 = −0.32 eo; Shab = −0.43 eo.
Figure 1
Figure 1
Sequence alignment of the S2–S4 regions of the four voltage-gated potassium channels in this study. The proposed membrane spanning regions are indicated by lines. Bold letters indicate conserved charged residues. Numbers at the beginning and end of each segment refer to amino acid numbering. Shaker numbering corresponds to the Shaker B1 splice variant (Schwarz et al. 1988). Sequences are taken from Chandy and Gutman 1995.
Figure 3
Figure 3
Gating currents from Shaker, Kv2.1, and Shab channels. Gating currents were recorded in the cell-attached configuration in the case of Shaker and Kv2.1, and in whole-cell for Shab. (A) Representative traces of gating currents recorded from a holding potential of −100 mV (Kv2.1) or −90 mV (Shaker and Shab) in 10-mV increments. Test pulses for Shaker are from −110 to 10 mV; for Kv2.1 from −85 to 45 mV; and for Shab from −140 to 20 mV. (B) Voltage dependence of the normalized charge movement obtained from numerical integration of the ON gating currents. The dashed curve represents the voltage dependence of activation of Kv2.1 macroscopic currents and is shown for comparison. Continuous curves are fits to a Boltzmann function with the parameter values: Shaker q s = 2.24 eo, Vo = −45.9 mV; Kv2.1 q s = 1.98 eo, Vo = −34.9 mV; Shab q s = 1.2 eo, Vo = −43.6 mV. (C) The voltage dependence of the time constant derived from a single exponential fit to the decaying phase of ON gating currents. Symbols are as in B. The data in the depolarized voltage range were fitted to exponential function of voltage to yield partial charge values q on = 0.39, 0.69, and 0.33 eo for Shaker, Kv2.1, and Shab, respectively.
Figure 4
Figure 4
Calculation of the apparent gating charge content from the limiting slope in Shaker channels. (A) Representative traces of channel activity in a multichannel patch at the indicated membrane potentials. This patch contained 2,250 channels, as estimated from fluctuation analysis at +70 mV. From a holding potential of −80 mV, pulses of duration 300–400 ms to the indicated potential were applied once per second. (B) The time course of the open probability, reconstructed from sets of 200–300 sweeps at each potential. Note the very steep voltage dependence of steady state open probability (∼10-fold/5 mV). During the total of 1,500 sweeps, no channel openings were detected at −80 mV. (C) The P(V) relationships from three experiments are shown with fits (lines) to exponential functions () over the range P = 10−7 to 10−3. The apparent gating charges q l from these fits are 12.9, 12.4, and 12.8 eo. (D) The logarithmic slope q s () is plotted as a function of P. The solid curve is the predicted relationship for a fourth-power Boltzmann function having charge 3.25 eo per subunit, yielding a total charge 13 eo. The dashed curve is the relationship for a single Boltzmann function with charge 13 eo. Different symbols indicate individual patches. (E) Values of q s plotted against voltage. (•) The macroscopic charge movement 1 − V of the W434F mutant recorded under the same conditions in a patch from a different oocyte; it has been scaled to a total charge q T = 13 eo.
Figure 5
Figure 5
Limiting-slope measurement of the charge in Kv1.1 channels. (A) Single-channel openings from a cell-attached patch containing n = 125 channels, induced by 800-ms depolarizations from −80 mV to the potentials shown. (B) The reconstructed time course of NP, plotted semilogarithmically. (C) The apparent charge q s, computed from P(V) according to and plotted as a function of open probability P. The continuous curve is the fourth power of a Boltzmann function with a total charge of 13 eo; the dotted curve is a single Boltzmann function with the same amount of charge. Different symbols represent different experiments. (D) Values of q s as a function of voltage. The continuous curve is a fitted Boltzmann function representing the voltage dependence of charge movement, computed with q T of 13 eo.
Figure 6
Figure 6
Limiting-slope measurement of the charge in Kv2.1 channels. (A) Single Kv2.1 channel events recorded at the indicated potentials after holding the patch for 400 ms at −80 mV. The data sweeps are not consecutive. Fluctuation analysis from macroscopic currents at 70 mV yielded an estimate of N = 1,500 channels. (B) Time course of NP obtained from the same patch in A; each trace represents the average of 300–400 idealized sweeps. (C) Open probabilities from six experiments transformed according to . Superimposed in the data are two solid curves showing the fourth power of a Boltzmann function scaled to a total charge of 12 and 13 eo. The dotted curve is a simple Boltzmann function with 13 eo. The inset depicts one experiment's voltage dependence showing the extent of the P values explored. (D) Voltage dependence of the apparent gating charge (open symbols), compared with q T [1 − V], where Vis the normalized charge movement derived from gating currents and q T was 12.5 eo (filled symbols). The continuous curve is a Boltzmann function calculated with a charge of 12.5 eo.
Figure 7
Figure 7
Ruling out artifacts in the estimation of charge in Kv2.1 channels. (A) Macroscopic Kv2.1 currents in response to a double-pulse protocol. The second pulse voltage was fixed at 20 mV and the potential of the 400-ms prepulse was varied from −100 to −10 mV. (B) Steady state inactivation function from the data in A. Plotted is the ratio of the current at the end of the second pulse to the current without prepulse, as a function of prepulse potential. The continuous curve is the function:I I 0=A1+e VV0qkT+1−A,where A = 0.27 is the maximum relative inactivation; q = 5.2 eo and V o = −30 mV. (C) Dwell-time distributions at negative voltages. Histograms in the left column are the open times and those in the right show the closed times. Superimposed are the maximum-likelihood fits to single and double exponential functions of the open and closed times, respectively. (D) Voltage dependence of the time constant of the long closed state and the mean burst duration. Plotted are mean values from four patches and the error bars show the standard deviation. The parameters of the fits (lines) are given in Table .
Figure 8
Figure 8
Substate kinetics in Shab channels. (A) Current traces at −70 mV from a patch containing three channels. The different horizontal dotted lines indicate the closed, substate, and full open levels. Note the various types of transitions indicated by the numbers. From the substate, a channel can either (1) close or (2) proceed to the fully open state; direct transitions from closed to fully open also occur (3). (B) All-point amplitude histograms from 200 sweeps at the indicated membrane potential. The histograms were fitted to a sum of three Gaussians and the individual components are shown. The letters identify the closed, substate, and fully open states according to the current amplitude. Absolute probabilities of being in the substate are: 0.078 at −70 mV, 0.012 at −80 mV, 0.0084 at −90 mV, and 0.021 at 10 mV. The probability of being in the fully open state are: 5.2 × 10⁻² at −70 mV, 1.4 × 10⁻³ at −80 mV, 1.4 × 10⁻⁴ at −90 mV, and 0.75 at 10 mV. The histograms are from a patch containing three channels, except for the histogram at 10 mV, which is from a single-channel patch. (C) Steady state occupancies of the open (filled symbols) and subconductance (open symbols) states. Squares are data obtained from a one-channel patch in which the external K+ concentration [K+]o = 10 mM, and circles are from a multiple channel patch with [K+]o = 60 mM. Points from the low [K+]o patch have been shifted by −20 mV to approximately compensate for the shift in activation due to altered external potassium. The continuous curve represents the open-state probability as a function of voltage and the dotted curve is the probability of the substate, computed from the scheme shown, where the equilibrium constants at 0 mV and their effective charges are: K 1 = 1.18, 1.2 eo; K 2 = 1.18, 0.6 eo; K 3 = 2.4, 1.8 eo. (D) Kinetic description of substate and opening transitions at negative potentials. Values of rate constants at −70 mV are given; in cases where a clear voltage dependence could be discerned over the voltage range of −90 to −65 mV, partial charges are also given in parentheses. The first latency to channel opening is roughly accounted for by the rate from state C to Cn (arrow at top left). Dotted arrows indicate transitions that occur but whose rates we could not determine.
Figure 9
Figure 9
Limiting-slope measurements of Shab channels expressed in Sf9 cells. (A) Recordings of single channel openings at the indicated membrane potential in a cell-attached macro patch containing N = 230 channels, as estimated from noise analysis at 60 mV. The dotted line represents the start of the depolarization to the given voltage, from a holding potential of −90 mV. Some openings to the subconductance state are indicated as S and openings to the fully open conductance as F. (B) Time dependent (averaged) NP values obtained from the idealization of 300–400 traces such as those in A, in which only full openings were counted. (C) The complete activation curve for two patches obtained after combination of the single channel data with macroscopic [G(V)] data. The continuous curve is a fourth-power Boltzmann function with total gating charge of 7.5 eo. (•) The occupancy of the subconductance state at negative voltages, fitted with an exponential function (solid line) with a charge of 2.2 eo. (D) From the data in C, for the fully open state, the effective charge is plotted as a function of P. The continuous curve is the prediction from a fourth-power Boltzmann function with a charge of 7.5 eo. (E) The same data plotted against voltage (open symbols). The filled symbols represent the function q T [1 − V] derived from gating currents, with q T = 7.5 eo.
Figure 10
Figure 10
Shab channels appear to have only one fully open state. (A) Single-channel traces recorded from a cell-attached patch at the indicated voltages. The patch contained only one channel as judged from the absence of overlapping openings. S indicates subconductance events; F indicates full conductance events. Bath solution was the standard composition. The pipette contained (mM): 5 K-aspartate, 5 KCl, 1.8 CaCl2, 100 NMDG-aspartate, 10 HEPES, pH 7.4. (B) Dwell-time distributions in the fully open (left) or closed (right) states. Superimposed on the histograms are maximum-likelihood fits to an exponential function for the open-time histogram, or a mixture of three exponentials for the closed time histogram. (C) Voltage dependence of the time constants. Filled symbols are the open-time constant and open symbols represent the three detected closed-time constants. The fitted lines represent exponential functions of voltage with the effective charges shown. (D) Prepulse inactivation in Shab channels. A prepulse of 500-ms duration was given at the indicated membrane potential and the current at a subsequent fixed depolarization of 40 mV was measured. The continuous curve is a fit to the same function as in Fig. 7 from −90 to −20 mV. The fit parameters are: A = 0.39, q = 8.1 eo, and V o = −47 mV.

Similar articles

Cited by

References

    1. Aggarwal S., MacKinnon R. Contribution of the S4 segment to gating charge in the Shaker K+ channel. Neuron. 1996;16:1169–1177. - PubMed
    1. Almers W. Gating currents and charge movements in excitable membranes. Rev. Physiol. Biochem. Pharmacol. 1978;82:96–214. - PubMed
    1. Baker O.S., Larsson H.P., Mannuzzu L.M., Isacoff E.Y. Three transmembrane conformations and sequence-dependent displacement of the S4 domain in Shaker K+ channel gating. Neuron. 1998;20:1283–1294. - PubMed
    1. Benndorf K., Koopmann R., Lorra C., Pongs O. Gating and conductance properties of a human delayed rectifier K+ channel expressed in frog oocytes. J. Physiol. 1994;477:1–14. - PMC - PubMed
    1. Bezanilla F., Perozo E., Stefani E. Gating of Shaker K+ channels. II. The components of gating currents and a model for channel activation. Biophys. J. 1994;66:1011–1021. - PMC - PubMed

Publication types

Substances