. 1999 Oct 15;13(20):2670-7.
doi: 10.1101/gad.13.20.2670.

INK4a/ARF mutations accelerate lymphomagenesis and promote chemoresistance by disabling p53

Affiliations

INK4a/ARF mutations accelerate lymphomagenesis and promote chemoresistance by disabling p53

C A Schmitt et al. Genes Dev. .

Abstract

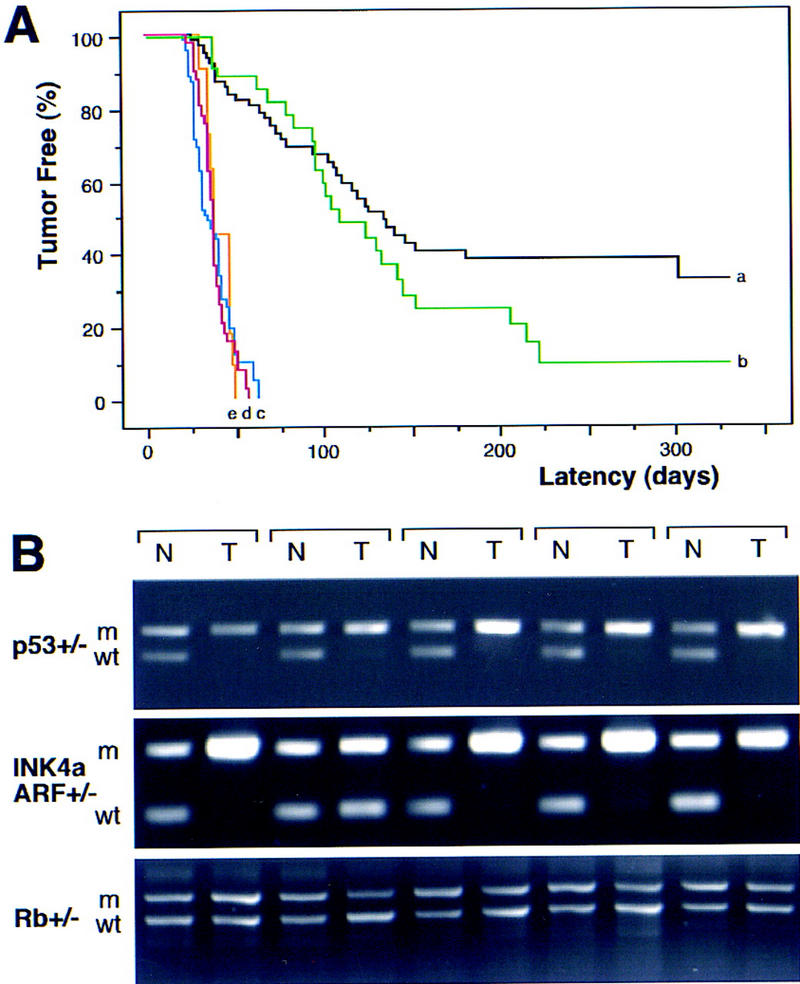
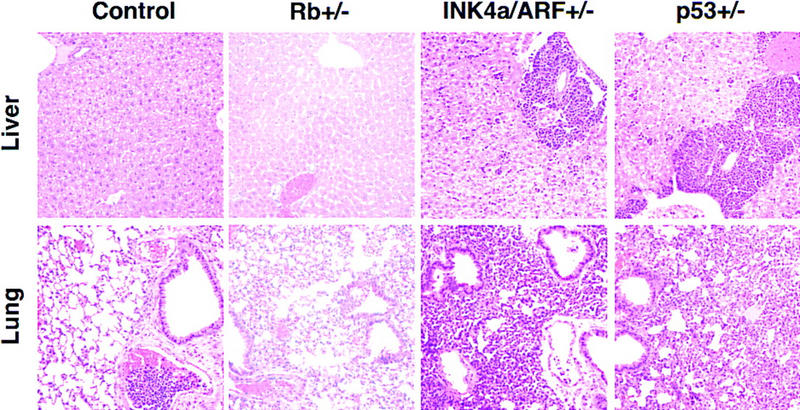
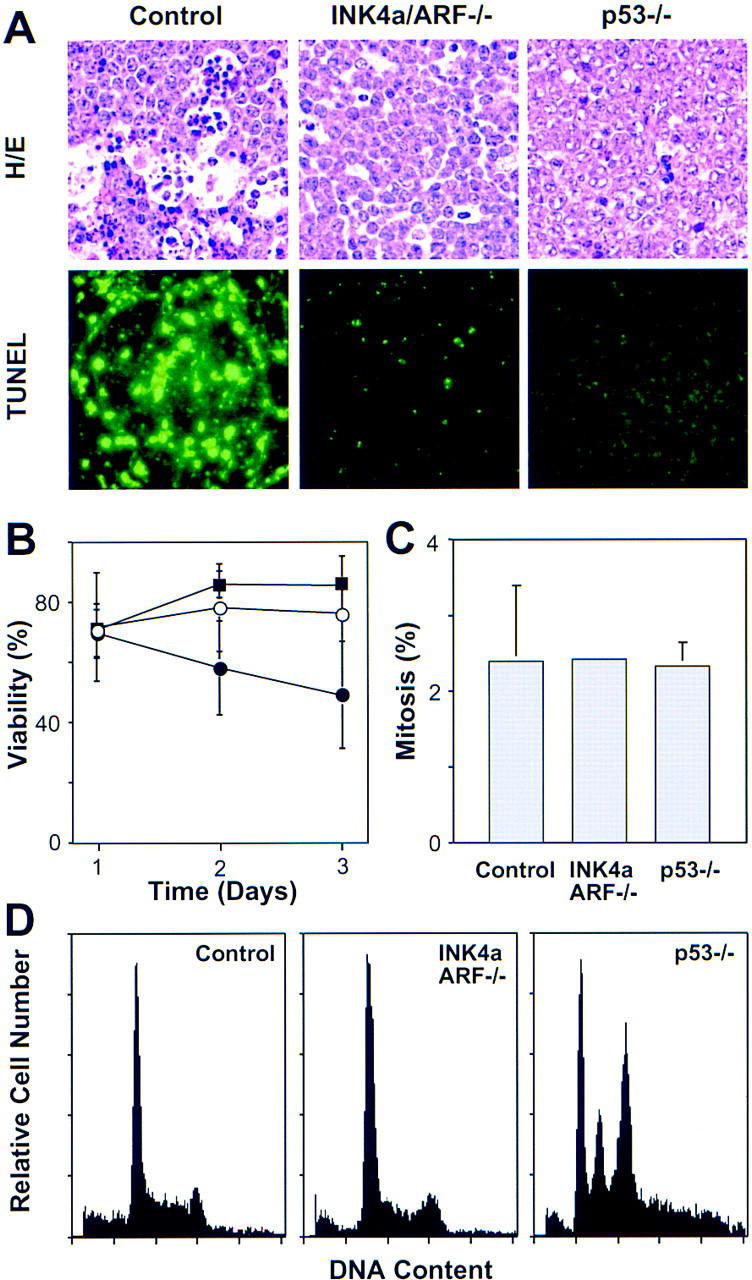
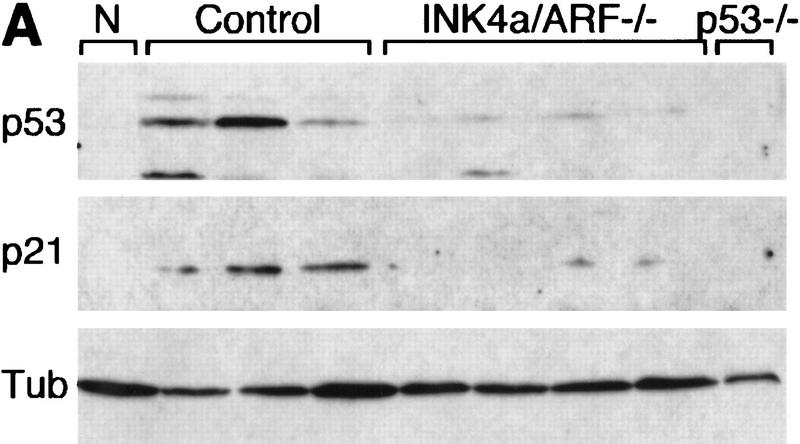
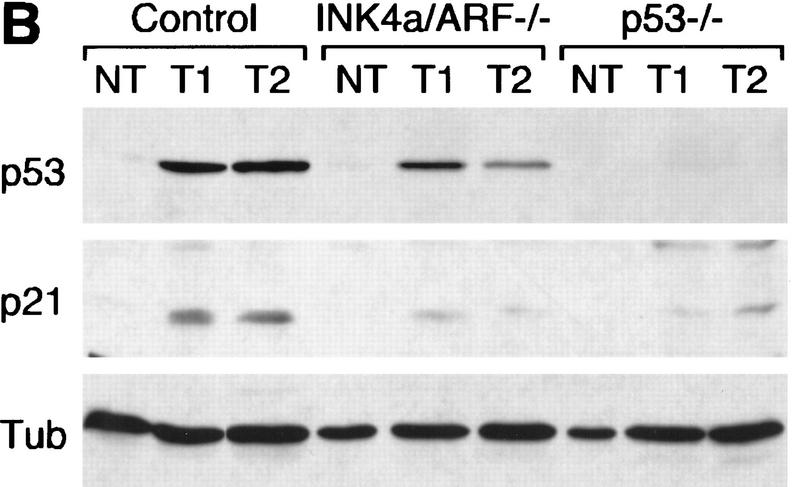
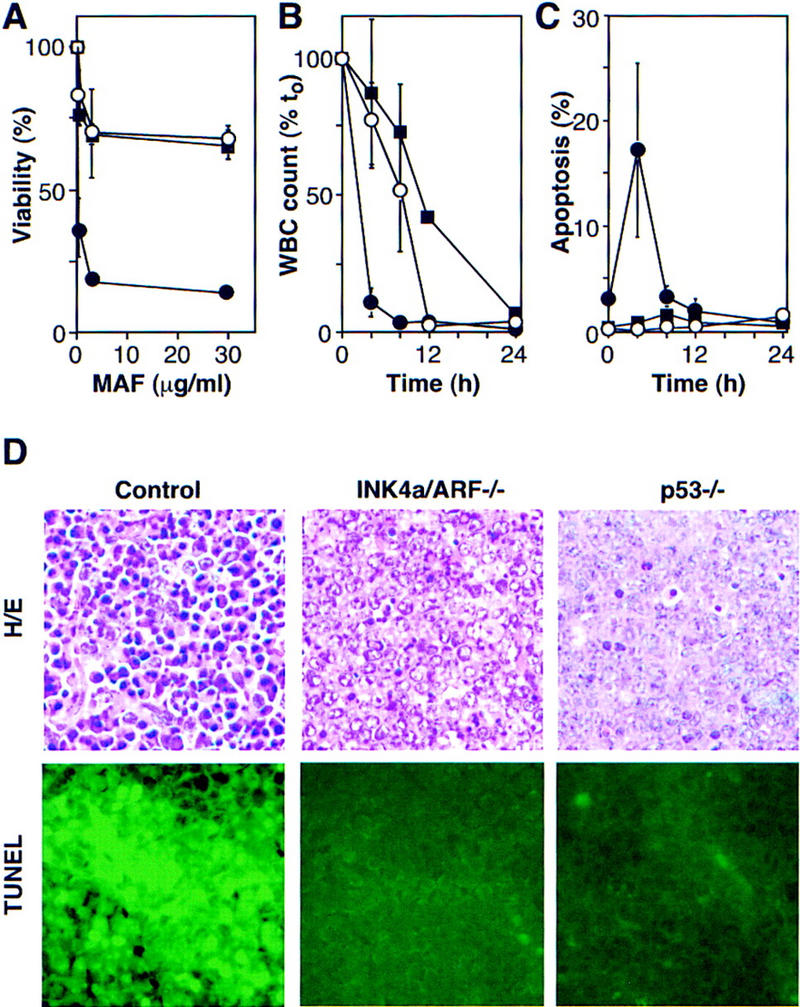
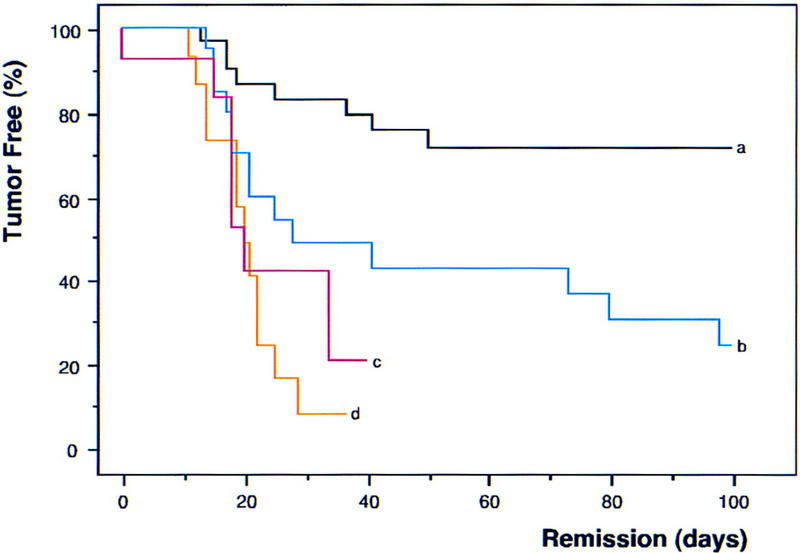
The INK4a/ARF locus encodes upstream regulators of the retinoblastoma and p53 tumor suppressor gene products. To compare the impact of these loci on tumor development and treatment response, the Emu-myc transgenic lymphoma model was used to generate genetically defined tumors with mutations in the INK4a/ARF, Rb, or p53 genes. Like p53 null lymphomas, INK4a/ARF null lymphomas formed rapidly, were highly invasive, displayed apoptotic defects, and were markedly resistant to chemotherapy in vitro and in vivo. Furthermore, INK4a/ARF(-/-) lymphomas displayed reduced p53 activity despite the presence of wild-type p53 genes. Consequently, INK4a/ARF and p53 mutations lead to aggressive tumors by disrupting overlapping tumor suppressor functions. These data have important implications for understanding the clinical behavior of human tumors.


Figures

Figure 1
Figure 1
Tumor development in Eμ–myc transgenic mice. (A) Lymphoma incidence in Eμ–myc transgenic mice in the wild-type (control) background (n = 65; black, a) and in mice heterozygous for Rb (n = 39; green, b), INK4a/ARF (n = 41; blue, c), p53 (n = 73; red, d), and INK4a/ARF; p53 double heterozygotes (n = 11; orange, e). By day 70, all p53+/− and INK4a/ARF+/− mice developed lymphoma, whereas >75% of Rb+/− and control mice remained tumor free. (B) Matched normal (N) and tumor (T) DNA were isolated from tail and lymph nodes and analyzed by allele-specific PCR for the targeted gene [(m) mutated allele; (wt) wild-type allele]. Shown are results from five Eμ–myc transgenic mice in each genetic background. Note that tumors arising in the INK4a/ARF+/−; p53+/− double heterozygotes invariably lost the wild-type p53 allele but never the INK4a/ARF allele.
Figure 2
Figure 2
Invasiveness of Eμ–myc lymphomas in liver and lung (H.E. staining, 200×). Representative examples of control, Rb+/−, INK4a/ARF−/−, and p53−/− lymphomas are shown. Note the malignant embolus in the pulmonary vessel of the control—nonetheless, the lung itself remained tumor free. The relative congestion of the Rb+/− lung is a postmortem artifact.
Figure 3
Figure 3
Analysis of apoptosis, proliferation, and chromosomal stability in Eμ–myc lymphomas. (A) Apoptosis in situ (lymph nodes) was visualized by HE staining and TUNEL. The reduced apoptotic rate observed in INK4a/ARF−/− tumors is consistent with a similar defect observed in the ocular lens of Rb−/−; INK4a/ARF−/− embryos (Pomerantz et al. 1998). (B) Viability of control (●), INK4a/ARF−/− (○), and p53−/− (█) lymphoma cells as measured by trypan blue exclusion after explanting onto feeder cells. (C) Proliferation as estimated by the percentage of mitotic figures in HE-stained lymphoma sections. (D) DNA content analysis of primary Eμ–myc lymphoma. The S-phase fractions of control (30.25% ± 8.31, n = 9) and INK4a/ARF−/− (29.98% ± 6.39, n = 10) were virtually identical, whereas subG1 fractions of control (3.26% ± 3.17) and INK4a/ARF−/− (0.30% ± 0.56) lymphomas were significantly different (P = 0.0097). Note that sub-G1 assessment recognizes only late apoptotic cells and gives lower estimates than TUNEL. Calculations of S-phase and sub-G1 fraction in p53−/− lymphomas were impossible due to aneuploidy. Representative profiles are shown. Note that low frequency of aneuploidy in control and INK4a/ARF−/− lymphomas (1 of 14 and 1 of 14, respectively) is consistent with the overall p53 mutation rate we observed in these tumors.
Figure 4
Figure 4
p53 levels and activity in untreated and CTX-treated Eμ–myc lymphomas. (A) Control (three independent tumors), INK4a/ARF−/− (four independent tumors), and p53−/− lymphoma lysates were probed against p53 and the p53 downstream target p21, reflecting p53's activity. Normal splenocytes (N) from nontransgenic mice were used for comparison. Tubulin (Tub) was used to verify protein loading. (B) Control, INK4a/ARF−/−, and p53−/− lymphoma cells were isolated from lymph nodes of untreated animals (NT) or 4 hr after CTX treatment (T1 and T2) and analyzed as above. For each tumor type, T1 and T2 were derived from separate primary tumors, whereas NT and T1 represent reconstituted lymphomas derived from the same primary tumor.
Figure 4
Figure 4
p53 levels and activity in untreated and CTX-treated Eμ–myc lymphomas. (A) Control (three independent tumors), INK4a/ARF−/− (four independent tumors), and p53−/− lymphoma lysates were probed against p53 and the p53 downstream target p21, reflecting p53's activity. Normal splenocytes (N) from nontransgenic mice were used for comparison. Tubulin (Tub) was used to verify protein loading. (B) Control, INK4a/ARF−/−, and p53−/− lymphoma cells were isolated from lymph nodes of untreated animals (NT) or 4 hr after CTX treatment (T1 and T2) and analyzed as above. For each tumor type, T1 and T2 were derived from separate primary tumors, whereas NT and T1 represent reconstituted lymphomas derived from the same primary tumor.
Figure 5
Figure 5
INK4a/ARF, p53, and short-term response to chemotherapy. (A) Explanted control (●), INK4a/ARF−/− (○), and p53−/− (█) lymphoma cells were treated with mafosphamide (MAF). Viability was analyzed after 24 hr by trypan blue exclusion; each value was normalized to untreated controls and represents the mean ± s.d. of two independently derived tumors reproduced in duplicate. (B) Leukemic mice were treated with CTX, and blood samples were taken at the indicated times. Each WBC is relative to its pretreatment value and represents the mean ± s.d. of three independent leukemias. Symbols are as in A. (C) Same as in B, except that blood samples were ethanol-fixed and stained with the DNA fluorochrome DAPI to visualize the chromatin condensation characteristic of apoptotic cells. Each value reflects the percentage of cells with apoptotic morphology (of 200 cells counted) and represents the mean ± s.d. of three independent leukemias. Symbols are as in A. (D) HE staining and TUNEL of lymph nodes harboring control, INK4a/ARF−/−, and p53−/− lymphomas 5 hr after CTX treatment.
Figure 6
Figure 6
INK4a/ARF, p53, and long-term response to chemotherapy. Nontransgenic mice harboring reconstituted control (n = 60; black, a), INK4a/ARF−/− (n = 35; blue, b), p53−/− (n = 14; red, c), and INK4a/ARF+/−; p53−/− (n = 15; orange, d) lymphomas were treated with CTX and monitored for tumor regression and relapse. Importantly, CTX is not affected by classic multidrug resistance mechanisms that might complicate drug delivery. Tumor shrinkage to nonpalpability within 6 days after treatment is considered ‘remission’ and creates the tumor-free population at time 0. Relapse was defined by recurrent palpable lymph node enlargement. Values were plotted in Kaplan-Meier survival curve format and presented as percentage of mice in remission over the time post-therapy. Note that the overall rate of treatment failure in control lymphomas (∼25%–30%) is consistent with the combined frequency of INK4a/ARF and p53 mutations we observe in these tumors.

References

    1. Adams JM, Cory S. Transgenic models for haemopoietic malignancies. Biochim Biophys Acta. 1991;1072:9–31. - PubMed
    1. Adams JM, Harris AW, Pinkert CA, Corcoran LM, Alexander WS, Cory S, Palmiter RD, Brinster RL. The c-myc oncogene driven by immunoglobulin enhancers induces lymphoid malignancy in transgenic mice. Nature. 1985;318:533–538. - PubMed
    1. Bates S, Phillips AC, Clark PA, Stott F, Peters G, Ludwig RL, Vousden KH. p14ARF links the tumour suppressors RB and p53. Nature. 1998;395:124–125. - PubMed
    1. Beroud C, Soussi T. p53 gene mutation: Software and database. Nucleic Acids Res. 1998;26:200–204. - PMC - PubMed
    1. Brown JM, Wouters BG. Apoptosis, p53, and tumor cell sensitivity to anticancer agents. Cancer Res. 1999;59:1391–1399. - PubMed

Publication types

MeSH terms